
The methodology for the Coin Metrics Prices (“CM Prices”) was originally developed in 2019 following a review of the financial pricing literature within both the digital assets and traditional financial assets industry. Extensive backtesting was conducted using several candidate methodologies and parameters before selecting the final methodology. Since its initial publication five years ago, Coin Metrics has continuously published the CM Prices without interruption and has had the opportunity to observe the behavior of the CM Prices under a wide range of scenarios, including instances of outliers, flash crashes, exchange outages, and times of market stress. Coin Metrics also regularly receives questions and solicits feedback from users of the CM Prices.
Coin Metrics conducted a review of the Coin Metrics Reference Rates (“CM Reference Rates”) (one of the prices that consist of the CM Prices) to propose methodology changes designed to improve its properties.
The review consisted of a systematic approach, beginning with the construction of a test set of 22 instances of abnormal market conditions where pricing is difficult. These conditions included incidents of wide spreads between major markets, heightened volatility, exchange outages, and outliers. The 22 instances spanned a wide range of assets of varying market capitalization and time frames. Proposed methodology changes were then assessed using four evaluation metrics designed to measure desirable properties of prices.
- The root mean of the difference in price between adjacent observations, after excluding observations with exactly zero change. This metric is designed to measure the degree to which a price experiences discontinuous changes or exhibits undesired volatility, without being skewed by scenarios with stale prices.
- The percentage of observations where the difference in price between adjacent observations is zero. This metric is designed to measure the degree to which a price remains unchanged.
- The number of times the algorithm results in a change of the selection of the median market. The CM Prices utilizes a weighted median in which a single market is ultimately selected to represent the price. This metric is also designed to measure the degree to which a price experiences discontinuous changes or exhibits undesired volatility.
- The average time between the calculation timestamp of the price and the timestamp of the trade from the median market that the pricing methodology selects. This metric is designed to measure the degree to which a price updates rapidly to changes to input data.
For each of the metrics, we compared the original methodology against multiple candidate methodologies with the goal of minimizing the value of each of the metrics. In other words, we optimized for methodology changes that would improve the CM Price’s timeliness to new input data, its responsiveness when input data is unexpectedly interrupted, and its ability to represent a continuous timeseries without undesired volatility, while remaining robust to outliers and times of market stress.
Based on this review, Coin Metrics proposes two changes to the CM Prices calculation algorithm for real-time frequencies (200 milliseconds, 1 second, and 1 minute):
- A check determines if a market is active based on the average time between adjacent trades in all markets. If a market is determined to be inactive, its trades are excluded from the calculation, swiftly minimizing the price impact from markets who have gone offline, particularly when such markets account for a significant portion of trading volume.
- A scale factor is applied to the inverse volatility, reducing its weight for markets where trades do not consistently occur in every 1-minute period. This prevents illiquid markets from receiving disproportionately large inverse volatility weights due to trade clustering at specific times.
The full description of the proposed changes are described in a revised calculation algorithm section below, where additions are indicated in green.
- Sort trades over the trailing 60 minutes from all markets together by trade time. Calculate the mean trade interval (“MTI”) for the asset by finding the difference in seconds between each sequential trade, and taking the mean of these differences. Calculate the active market cutoff by multiplying the MTI by 100. Find the time since the last trade on each market. Any market where the time since last trade is greater than the active market cutoff, will be excluded from Constituent Markets in the remaining calculation. If a market only has one trade, mark the market as active. If all markets are now inactive, then mark them all as active instead.
- Calculate the volume denominated in units of the given asset from observable transactions that occurred over the trailing 60 minutes for each of the Constituent Markets. Calculate the volume weight for each of the Constituent Markets by dividing the volume figure for each of the Constituent Markets by the total volume across all Constituent Markets. The resulting figure is referred to as the volume weight.
- Convert the trade price of all observable transactions over the trailing 60 minutes for each of the Constituent Markets to U.S. dollars if necessary using the Real-Time Reference Rate calculated for Bitcoin (BTC), Ethereum (ETH), USD Coin (USDC), or Tether (USDT). Calculate the inverse variance of the trade price converted to U.S. dollars for each of the Constituent Markets using the population mean in the calculation of variance, where the population mean is defined as the mean price of all trades from Constituent Markets over the trailing 60 minutes. If a Constituent Market has an infinite or undefined inverse price variance, the inverse price variance for that Constituent Market is set to zero. For each market independently, determine the number of minutes, out of the past 60, which contained an executed trade. Divide this value by 60 (the maximum), to produce an inverse variance scale factor. Finally, multiply the raw inverse variance for each market by the market’s inverse variance scale factor. This is the scaled inverse variance. Calculate the inverse price variance weight for each of the Constituent Markets by dividing the scaled inverse price variance by the total scaled inverse price variance across all Constituent Markets. The resulting figure is referred to as the inverse price variance weight.
- Calculate the final weight for each of the Constituent Markets by taking a mean of the volume weight and the inverse price variance weight.
- Extract the most recent observable transaction from each of the Constituent Markets. Convert the trade price of the most recent observable transactions to U.S. dollars if necessary using the Reference Rate calculated for Bitcoin (BTC), Ethereum (ETH), USD Coin (USDC), or Tether (USDT).
- Calculate the weighted median price of the most recent observable transactions using the prices calculated in step 4 and the final weights calculated in step 3. The weighted median price is calculated by ordering the transactions from lowest to highest price, and identifying the price associated with the trades at the 50th percentile of final weight. The resulting figure is the published reference rate for the given asset.
This proposed calculation algorithm results in a price that exhibits improved properties. In the charts below, we plot the original calculation algorithm (labeled “Reference Rate ORIG”) with the proposed calculation algorithm (labeled “Reference Rate TEST”).
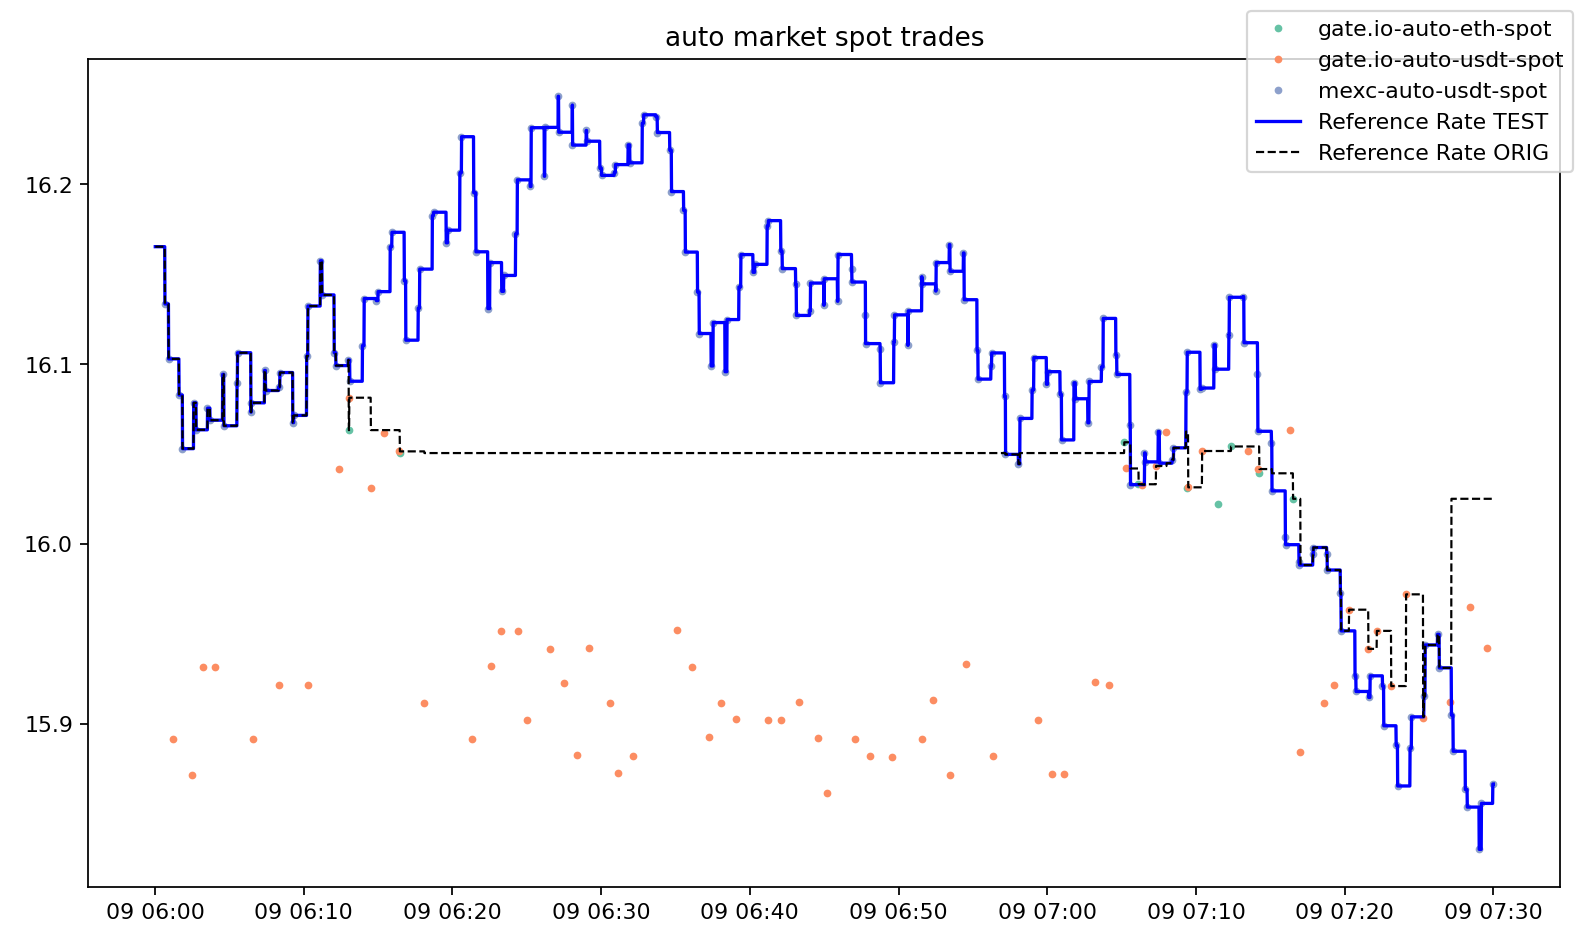
In the case of Auto (AUTO), the original calculation algorithm selected a low volume market as the median market for the majority of the studied time period, while the proposed calculation algorithm results in a price that updates more frequently. The proposed calculation algorithm addresses an edge case where the original calculation algorithm places high weight on a low-volume market.
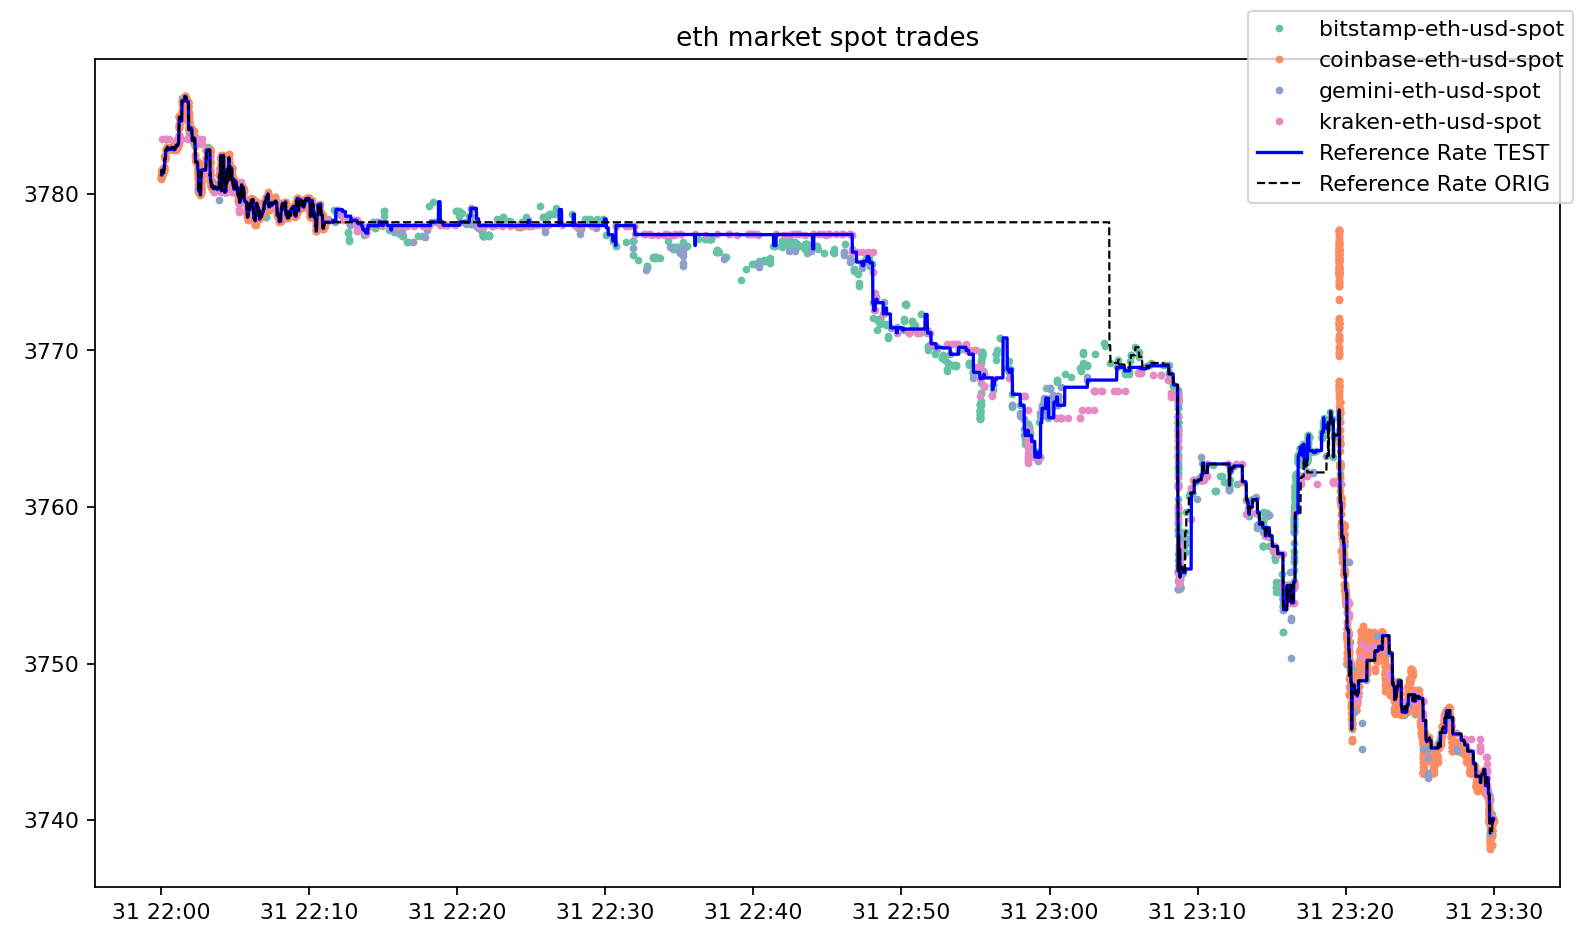
In the case of Ethereum (ETH), the proposed calculation algorithm results in a price that rapidly adjusts to an interruption to Coinbase’s data.
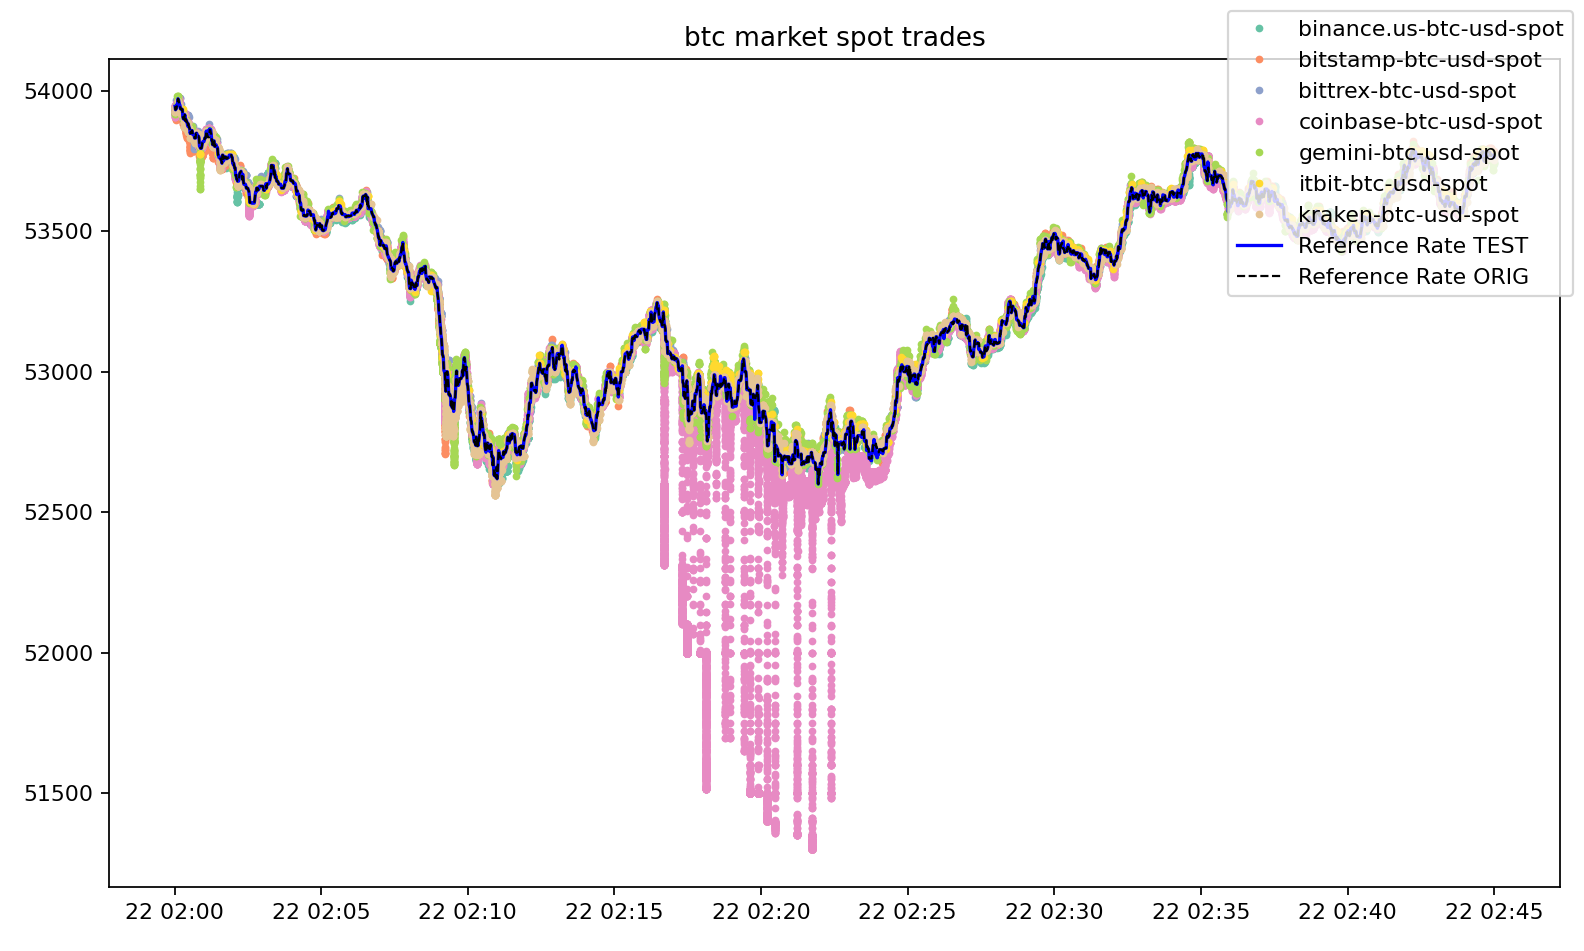
The proposed calculation algorithm retains desirable properties of our original algorithm, such as robustness to outliers as illustrated in a case where significant outliers occurred on Coinbase’s BTC-USD market.
In summary, we believe the proposed calculation algorithm will enhance responsiveness of the CM Prices to changes in input data and its ability to represent a continuous timeseries without undesired volatility. Additionally, it will remain robust against outliers and periods of market stress.
Coin Metrics will conduct a consultation period to gather feedback on the proposed changes, which will conclude on October 18, 2024. Please contact Coin Metrics through our website to share any comments or questions.