Enhanced Tools for Deep Market Intelligence
As cryptocurrency markets evolve in complexity, the need for sophisticated analytical tools has never been greater. Traditional metrics provide valuable insights, but advanced research applications demand deeper granularity and more nuanced indicators to understand market behavior, investor sentiment, and network usage patterns across different user segments.
That’s why Coin Metrics is excited to introduce our Advanced Research & Analytics Metrics, now available in Network Data Pro (NDP). This collection of indicators empowers researchers and institutional investors to conduct sophisticated market analysis unlocking new depth and precision.
With Advanced Research & Analytics Metrics, you can:
- Analyze cohort-specific behavior with Long Term Holder and Short Term Holder SOPR metrics
- Track micro-transaction patterns with granular transfer value segmentation down to $5 thresholds
- Monitor market positioning through Bitcoin dominance calculations
- Identify market extremes using statistically normalized indicators like MVRV Z-Score
- Gauge unrealized market sentiment with Net Unrealized Profit/Loss (NUPL) analysis
- Enhance quantitative models with statistically robust, research-grade data
Comprehensive Market Intelligence Tools
Our Advanced Research & Analytics Metrics address critical gaps in market analysis by providing specialized indicators that reveal hidden patterns in market behavior.
Each metric in this release offers unique insights into different aspects of market dynamics, from holder behavior segmentation to network utilization patterns, enabling comprehensive analysis across multiple dimensions of cryptocurrency market activity.
New Metrics Overview
Long Term Holder & Short Term Holder SOPR (Bitcoin)
Building on our flagship Spent Output Profit Ratio (SOPR) framework, we now offer cohort-specific analysis that separates market behavior between Long Term Holders (LTH) and Short Term Holders (STH). These metrics provide critical insights into different investor behaviors:
- SOPRLth: Measures profit realization patterns among long-term Bitcoin holders (UTXOs older than 155 days)
- SOPRSth: Tracks short-term holder profit-taking behavior (UTXOs younger than 155 days)
These cohort-specific metrics reveal when different investor classes are realizing profits or losses, providing early signals of market sentiment shifts and potential trend changes.
For more details see our comprehensive documentation for these metrics.
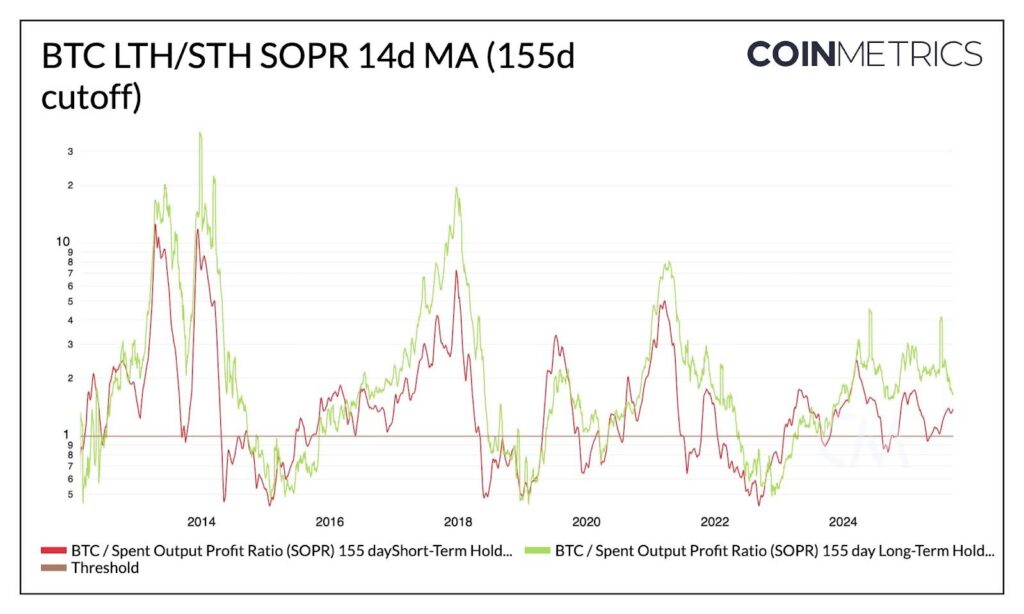
Source: https://charts.coinmetrics.io/formulas?id=11136
Micro-Transaction Analysis (All Assets)
Enhanced granular transaction analysis now includes transfer value metrics for smaller transaction amounts below $100, extending our coverage to include:$50, $20, $10, and $5.
Available in both count and value formats (native units and USD), these metrics provide comprehensive visibility into network usage patterns across all economic tiers.
Source: https://charts.coinmetrics.io/crypto-data/?id=11137
Bitcoin Market Dominance
Track Bitcoin’s market capitalization as a percentage of the total cryptocurrency market, providing essential context for:
- Cross-asset allocation analysis
- Market cycle positioning
- Altcoin season identification
- Institutional adoption benchmarking
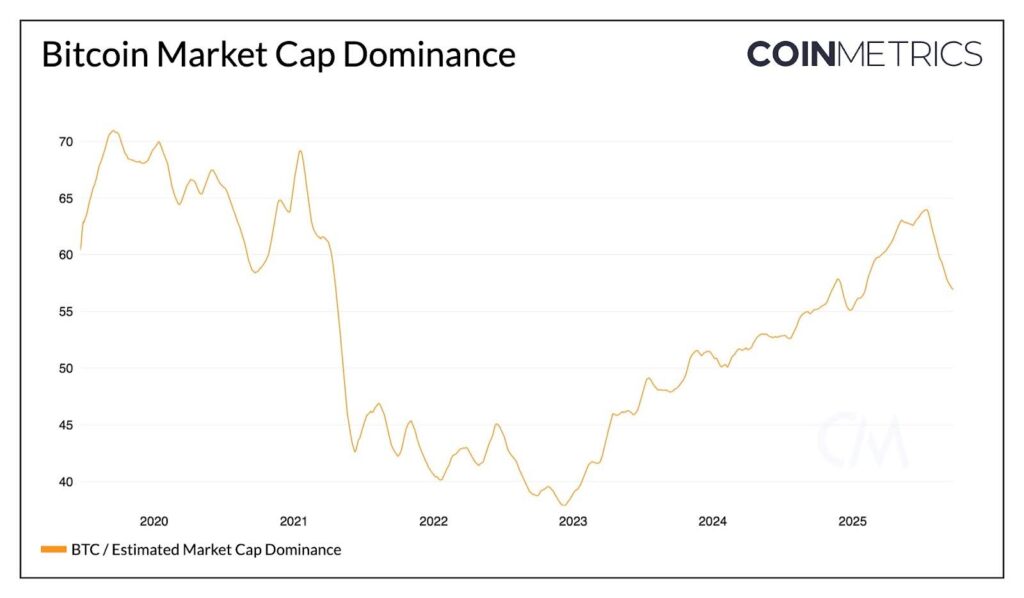
Source: https://charts.coinmetrics.io/crypto-data/?id=11143
MVRV Z-Score
A statistically normalized version of our Market Value to Realized Value ratio that accounts for long-term volatility patterns:
Calculation: (Current Market Cap – Realized Market Cap) / Standard Deviation of Market Cap
MVRV Z-Score highlights periods where assets may be significantly overvalued or undervalued relative to their historical behavior, making it particularly valuable for identifying market extremes and potential reversal points.
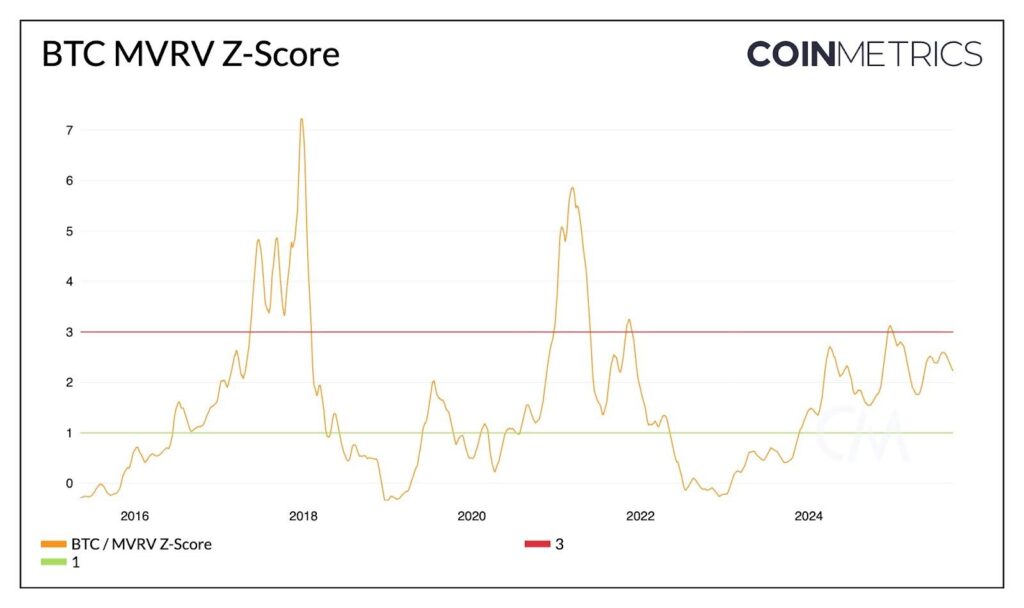
Source: https://charts.coinmetrics.io/formulas?id=11138
Net Unrealized Profit/Loss – NUPL
Measures the proportion of an asset’s market cap representing unrealized profit or loss among all coins in circulation:
Calculation: (Market Cap – Realized Cap) / Market Cap
NUPL provides direct insight into market-wide sentiment by indicating whether holders are collectively sitting on gains (positive NUPL) or losses (negative NUPL), offering valuable context for market positioning and momentum analysis.
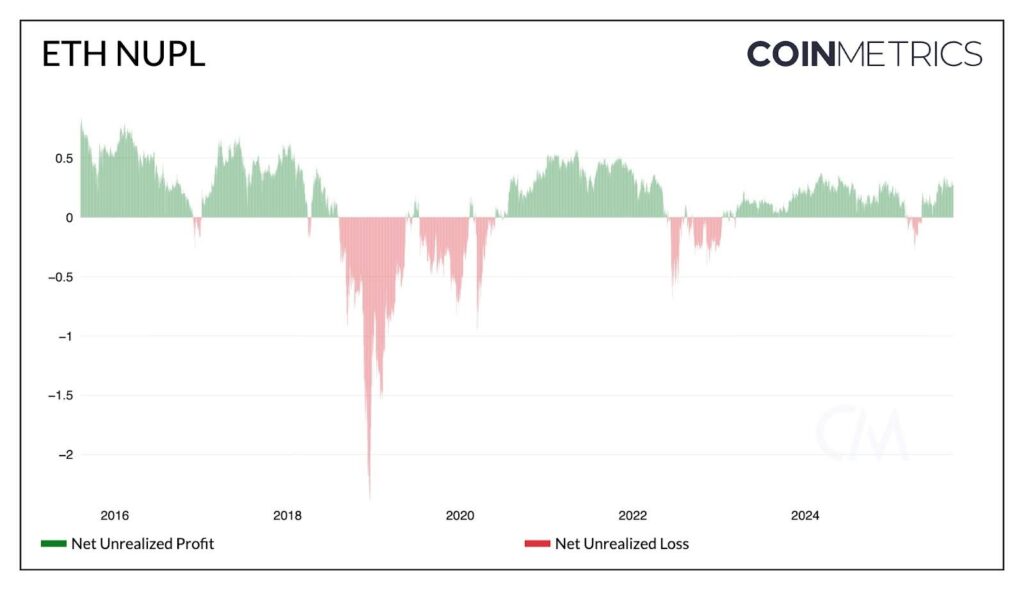
Source: https://charts.coinmetrics.io/formulas?id=11139
Implementation & Access
For Network Data Pro clients:
- All metrics are immediately available through standard API endpoints
- Historical data available from asset genesis (where applicable)
- Available as part of the existing subscription
Sample API Queries:
# LTH/STH SOPR Analysis
/timeseries/asset-metrics?assets=btc&frequency=1d&metrics=SOPRLth,SOPRSth
# Micro-transaction Analysis
/timeseries/asset-metrics?assets=eth&frequency=1d&metrics=TxTfrValBelUSD50Cnt,TxTfrValBelUSD20Cnt,TxTfrValBelUSD10Cnt,TxTfrValBelUSD5Cnt
# Advanced Market Indicators
/timeseries/asset-metrics?assets=btc,eth&frequency=1d&metrics=CapMVRVZ,NUPL
Resources & Documentation:
- Access via our timeseries/asset-metrics endpoint
- Comprehensive metric definitions in our Network Data documentation
- Research methodology and interpretation guides available through our support channels
Elevate Your Research Capabilities Today
Advanced Research & Analytics Metrics represent our commitment to providing the cryptocurrency industry’s most sophisticated analytical tools. Whether you’re conducting academic research, building quantitative models, or managing institutional portfolios, these enhanced metrics provide the depth and precision required for advanced market analysis.
These metrics have been specifically designed for users who demand research-grade data quality and statistical rigor in their analysis workflows. Each indicator has been extensively backtested and validated against historical market conditions to ensure reliability across different market environments.
Contact our team to explore how Advanced Research & Analytics Metrics can enhance your research and investment processes.