This special supplementary report features over 30 charts highlighting crypto data trends from Q3 2021. The charts are organized by asset type and divided into the following categories: large cap assets (e.g BTC, ETH, ADA, etc.), decentralized finance (DeFi) assets (e.g. UNI, SUSHI, COMP, etc.) and stablecoins (e.g. USDT, USDC, DAI, etc.). For our full Q3 2021 wrap-up check out our latest issue of State of the Network.
Bitcoin in Q3 2021
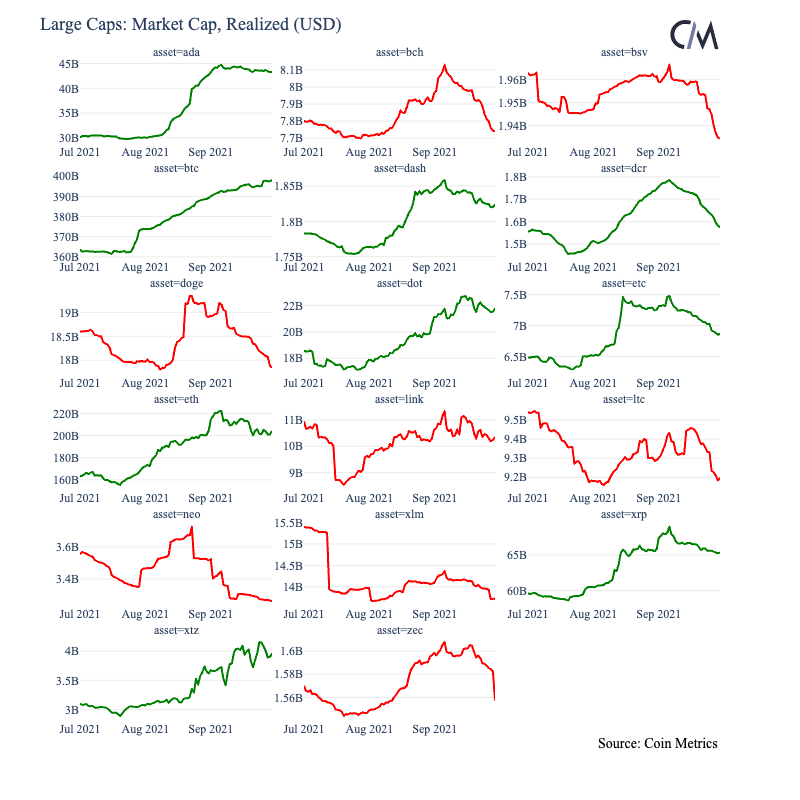
$398B: Realized cap on 9/30, an all-time high
$888B: Total value settled
$799B: Total spot volume across Coin Metrics trusted exchanges
$3.7B: Total miner revenue
Ethereum in Q3 2021
$729B: Total value settled (only ETH)
405K: Total ETH burnt ($1.35B)
$561B: Total ETH spot volume across Coin Metrics trusted exchanges
$4.1B: Total miner revenue
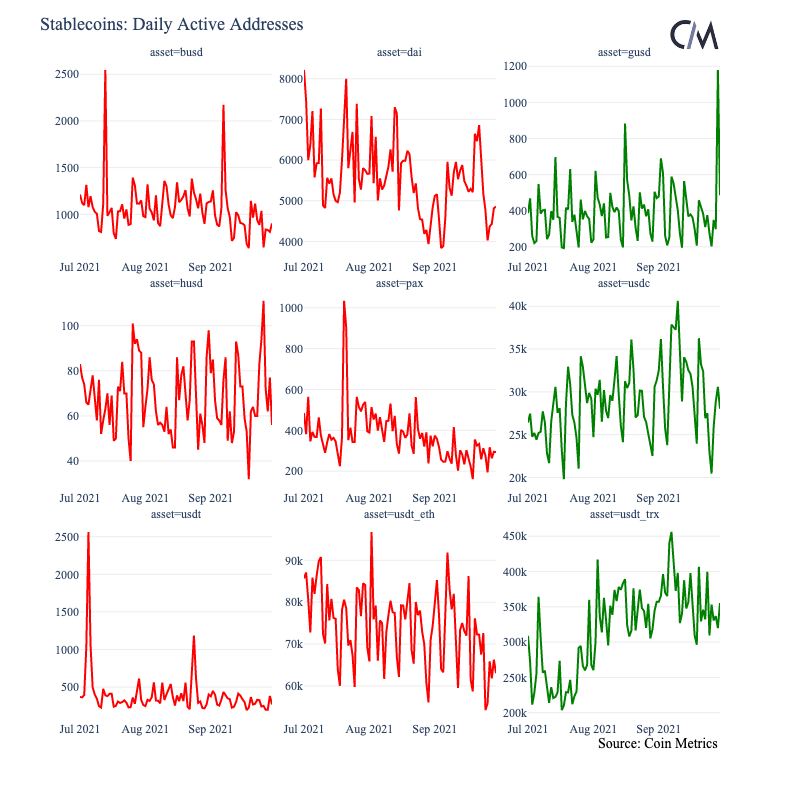
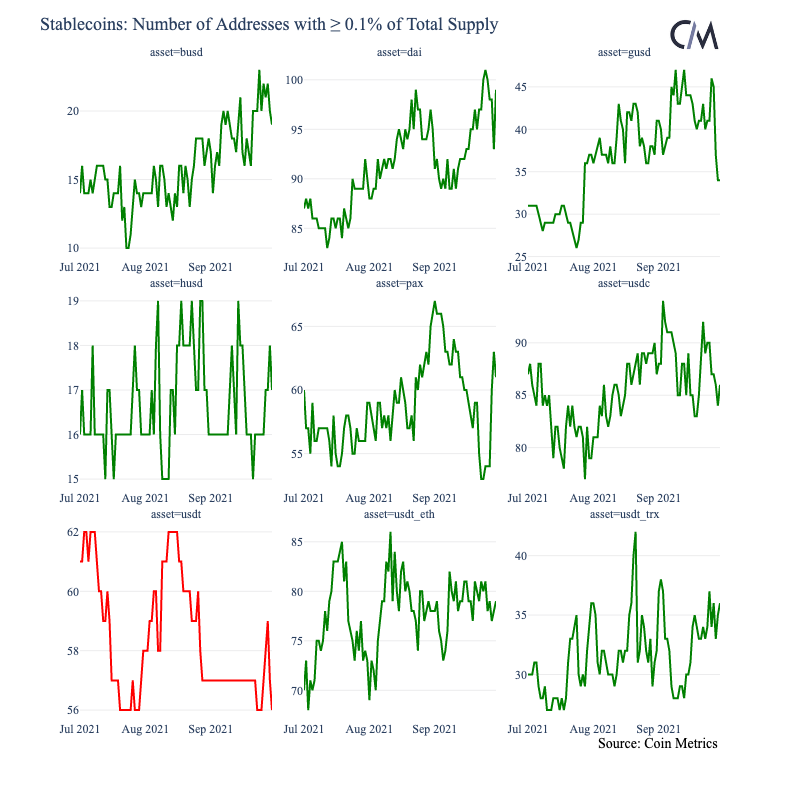
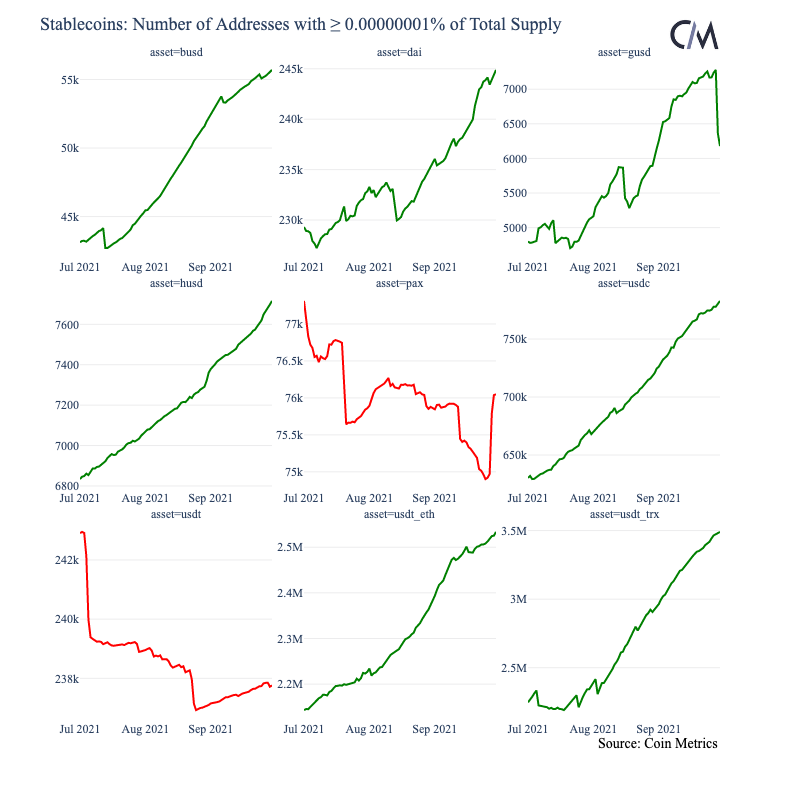
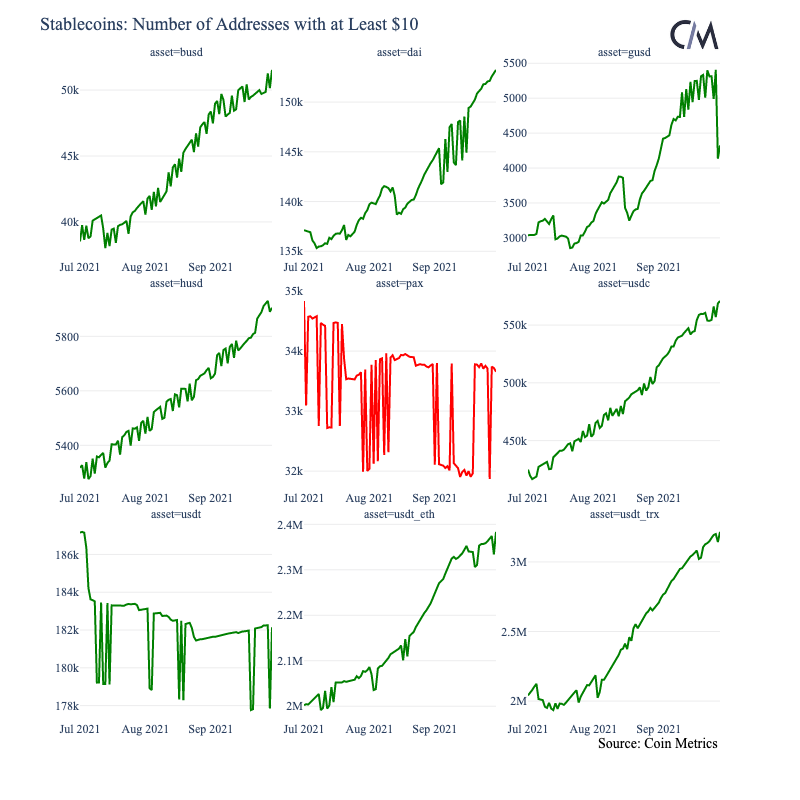
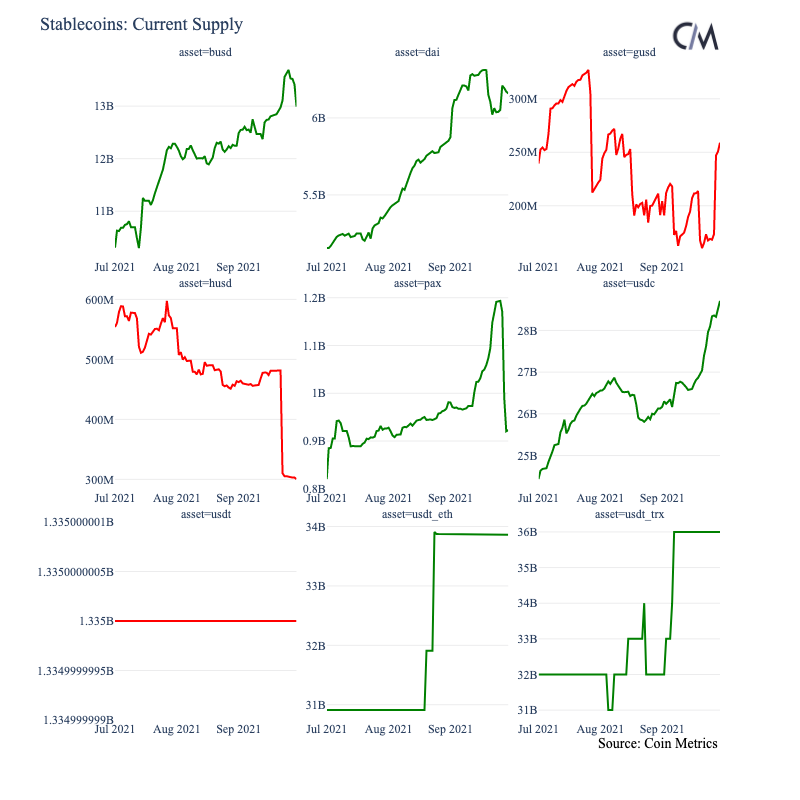
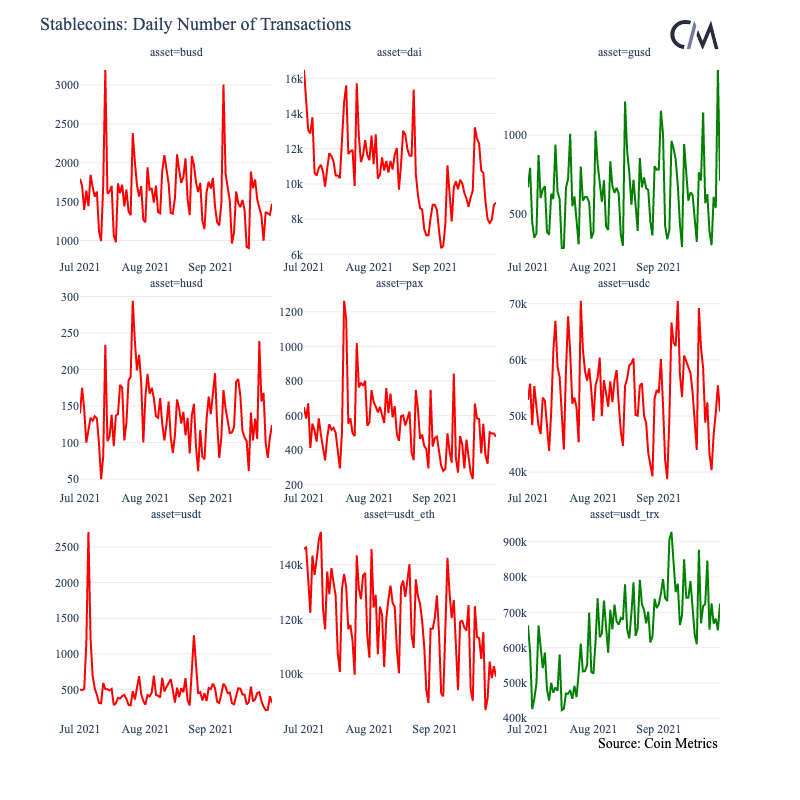
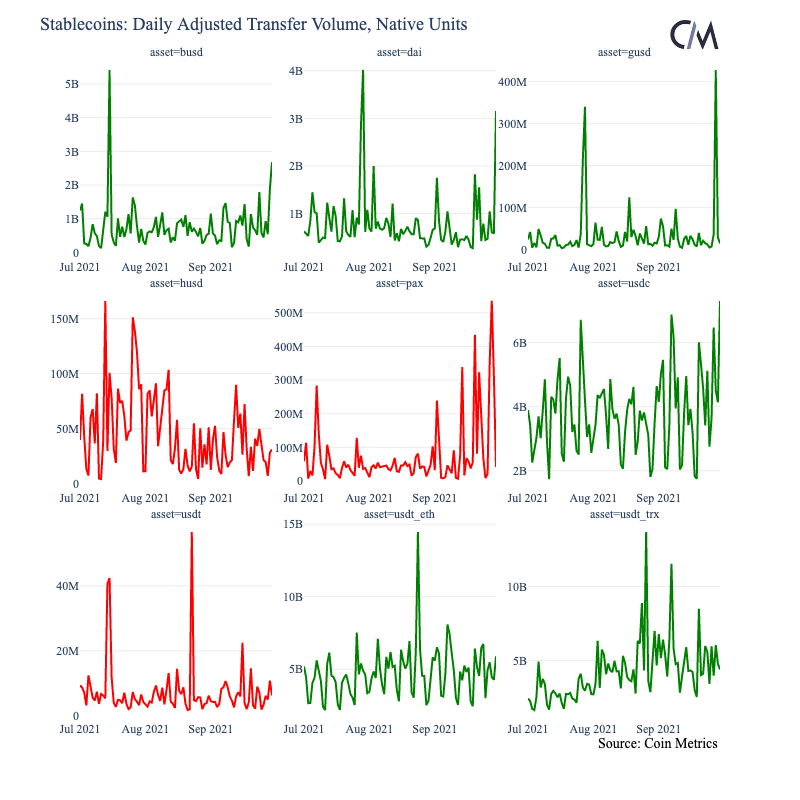
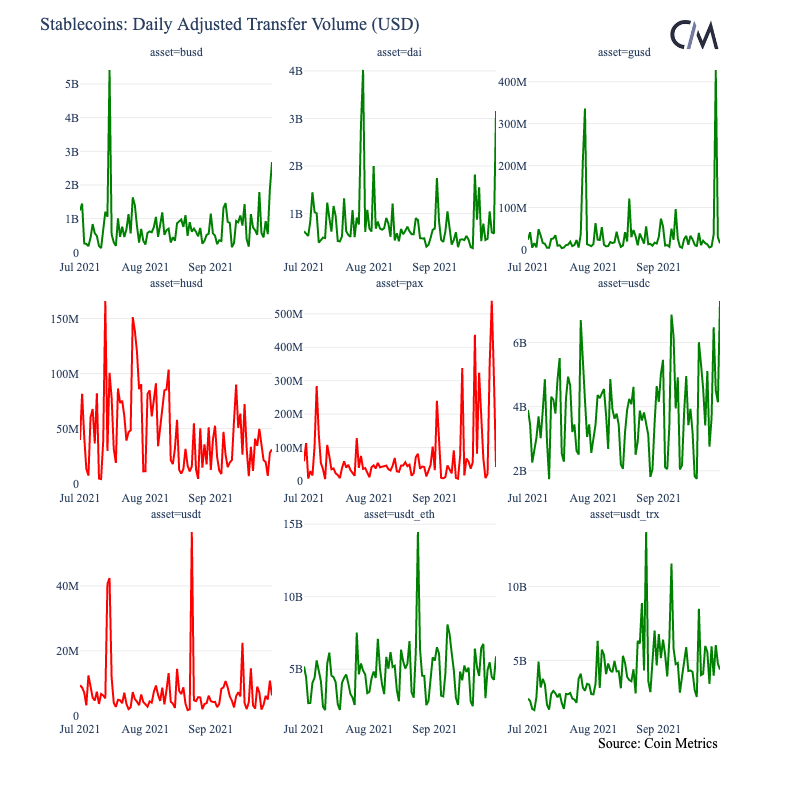
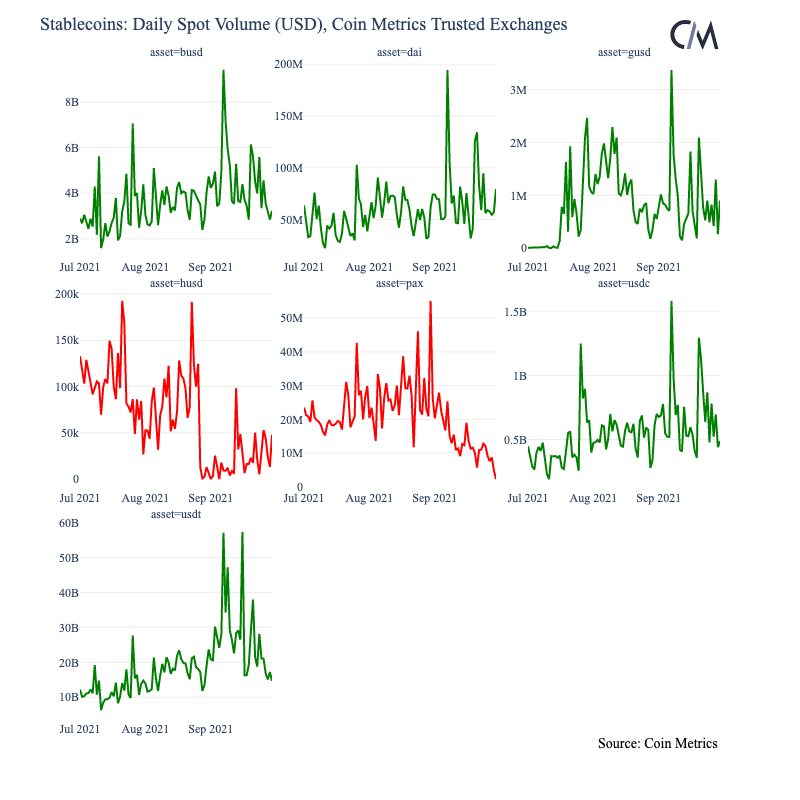
Stablecoins in Q3 2021
71.2B: Tether supply on 9/30, 11% QoQ growth
28.7B: USDC supply on 9/30, 18% QoQ growth
$9B: Average daily value settled with Tether
$91K: Average USDC transaction size
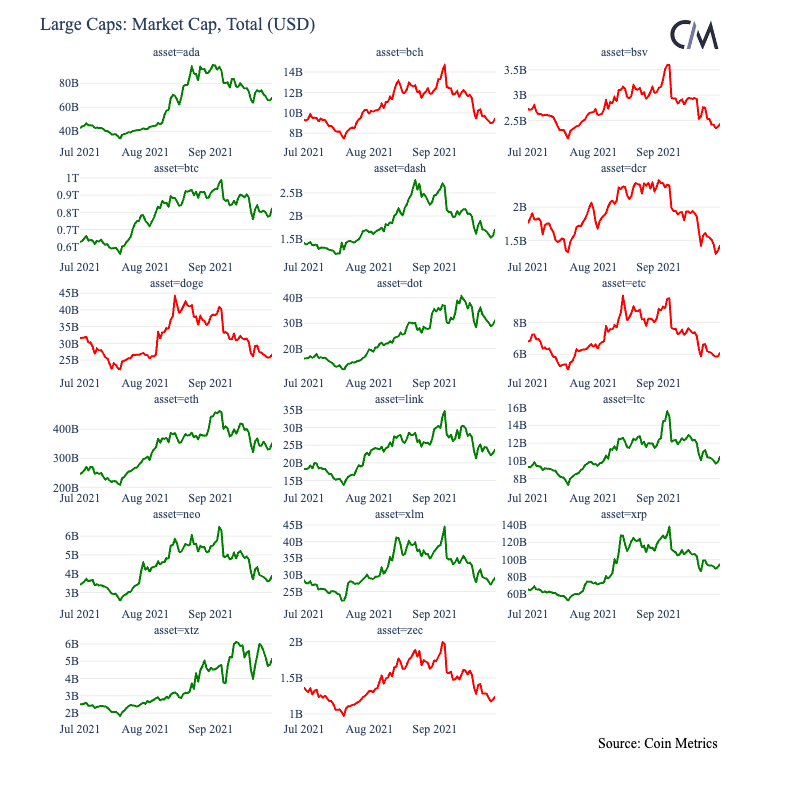
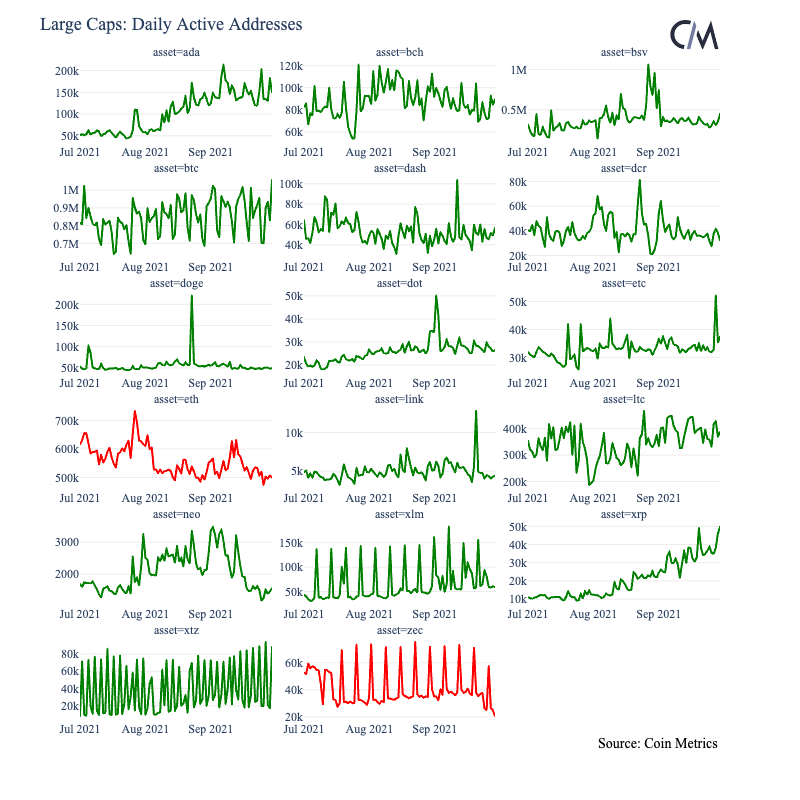
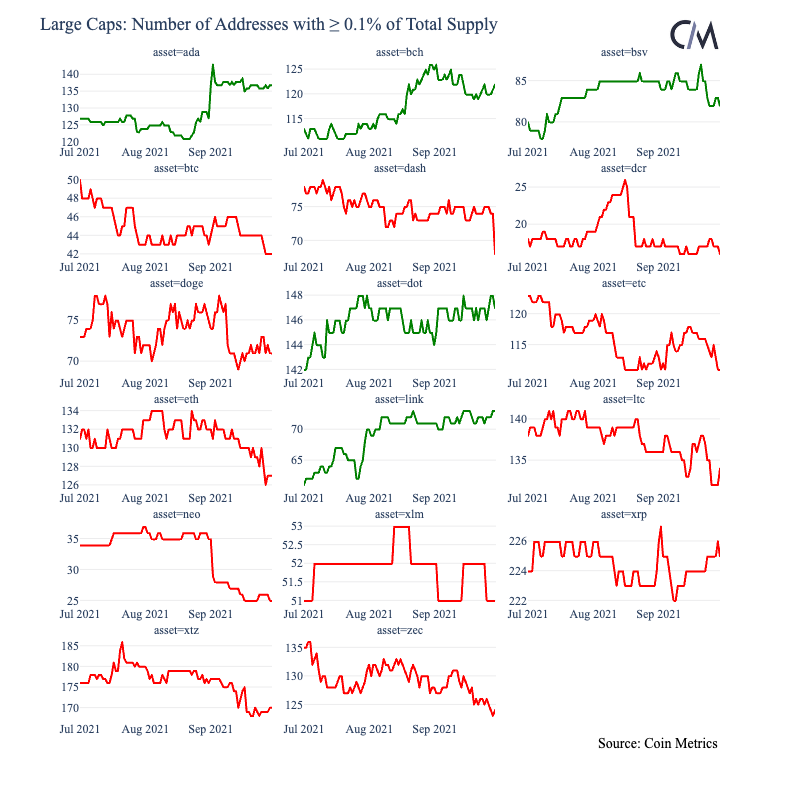
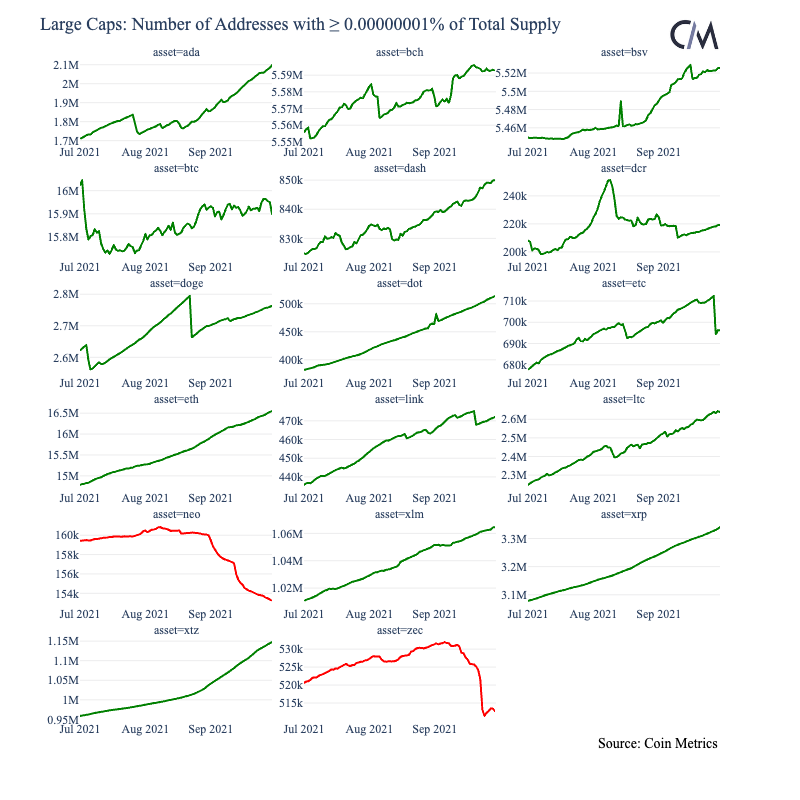
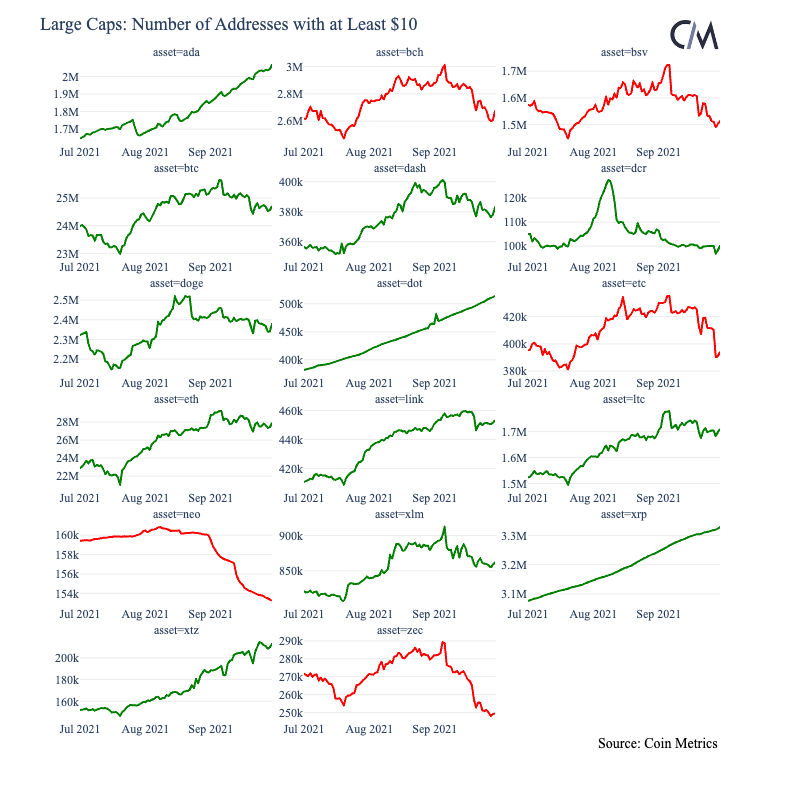
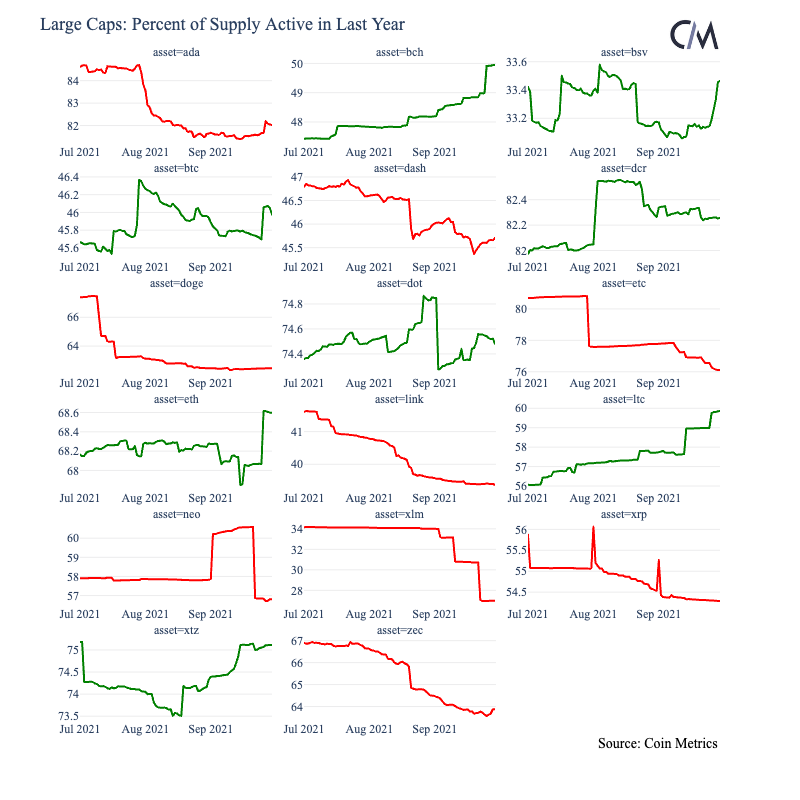
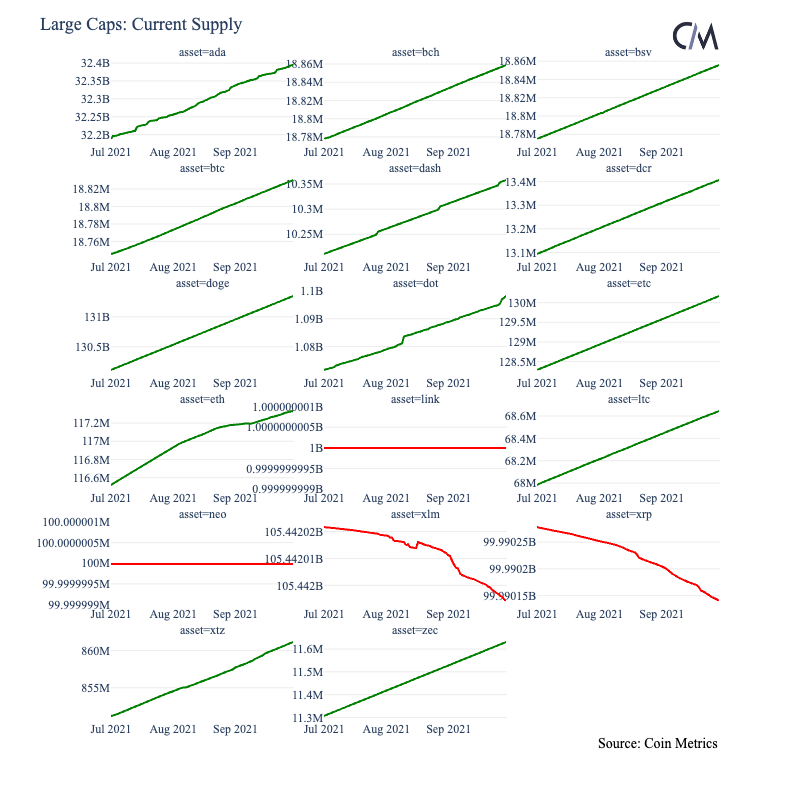
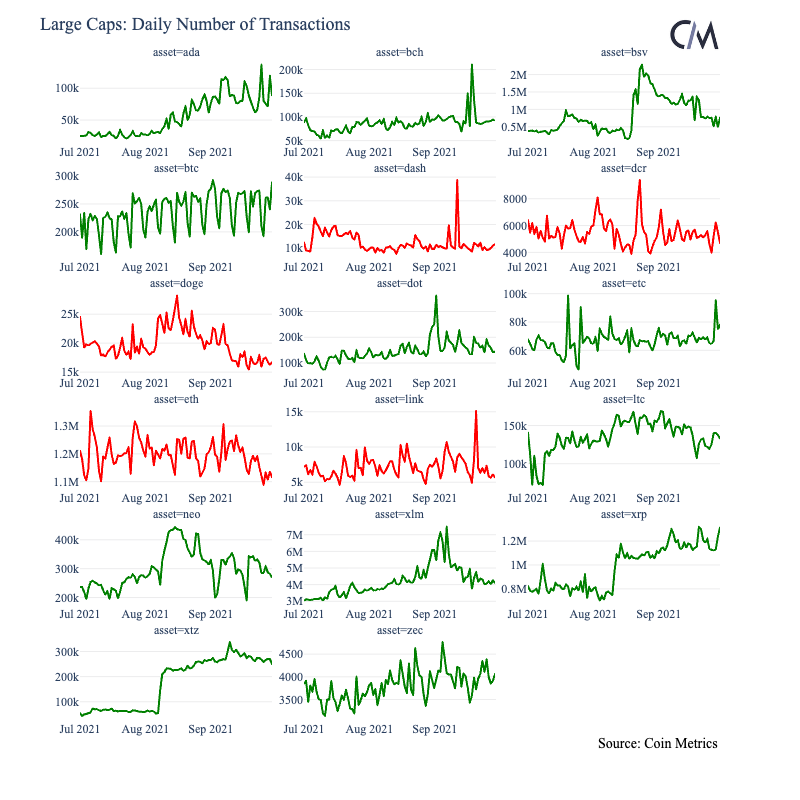
The table below shows the metrics we have chosen to highlight for this quarter. While it is often helpful to compare across chains, note that caution should be applied when comparing certain metrics across different blockchains. Metrics related to counts of addresses for example are likely to be incomparable between UTXO-based protocols (BCH, BTC) and account-based protocols (ETH) because addresses are frequently re-used in account-based protocols. Large Cap Assets
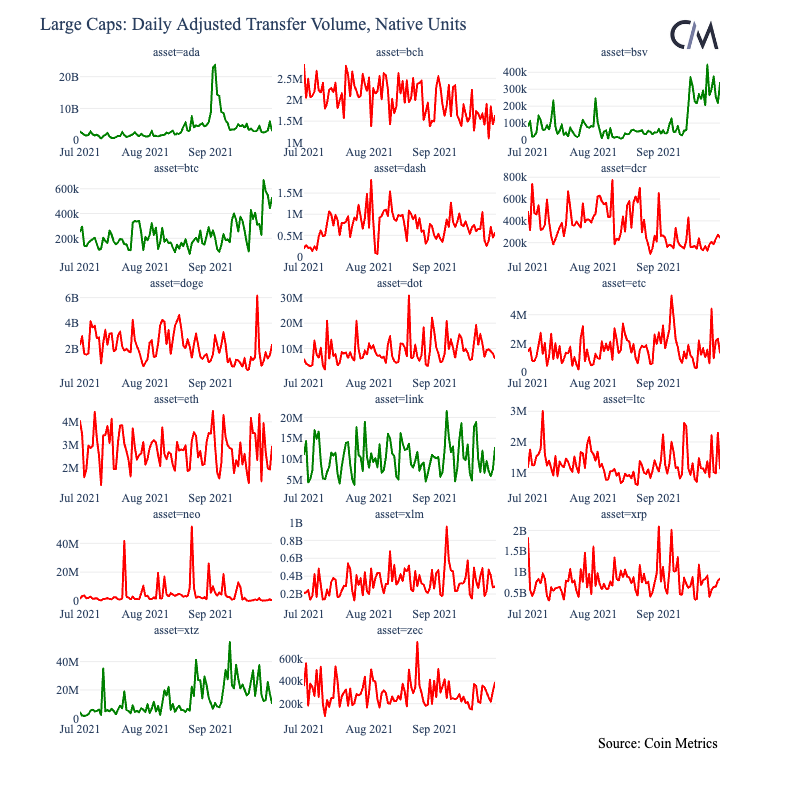
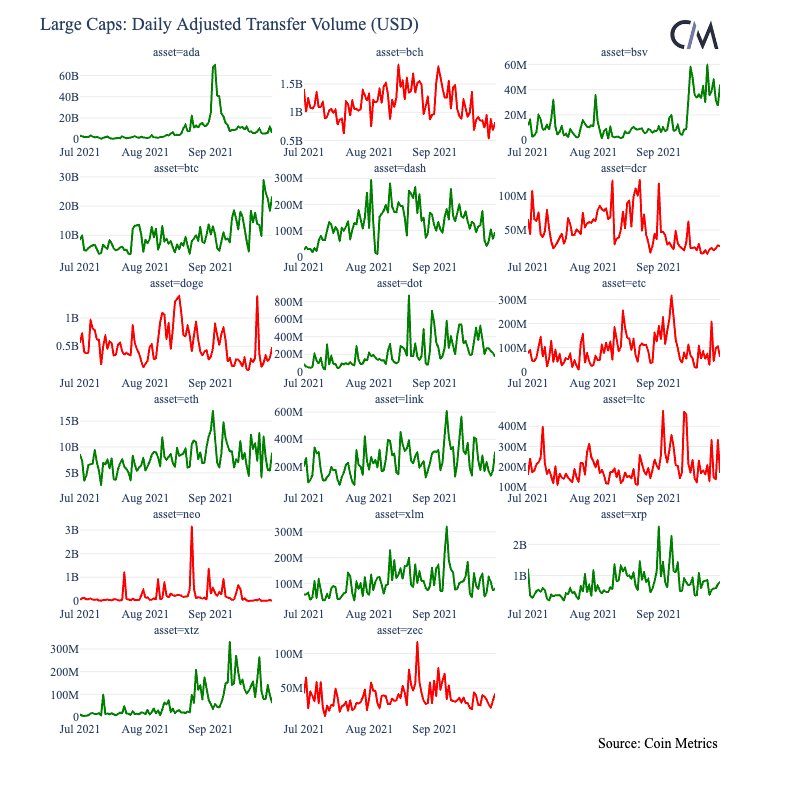
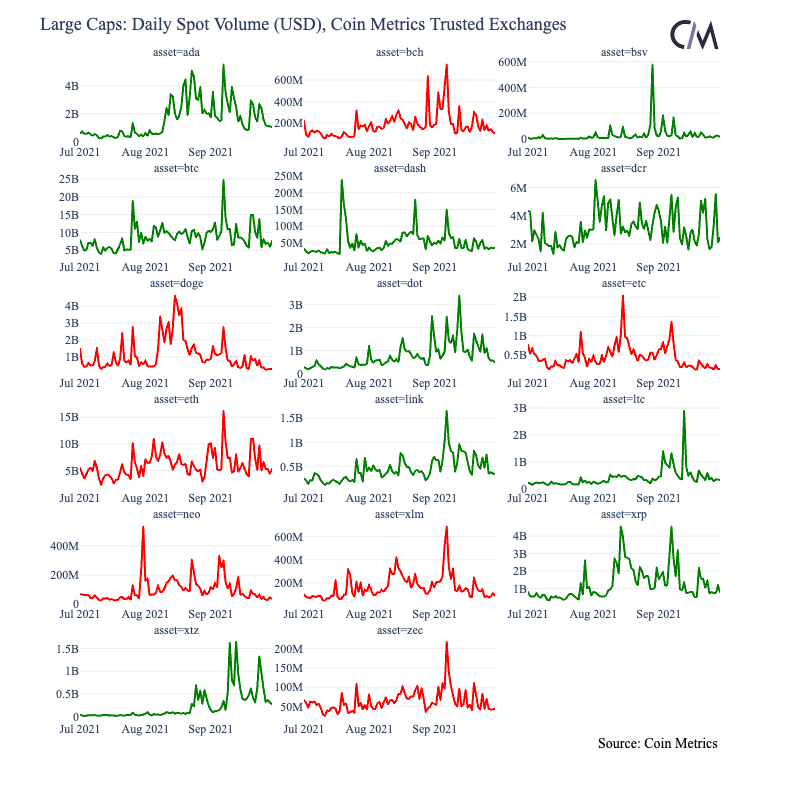
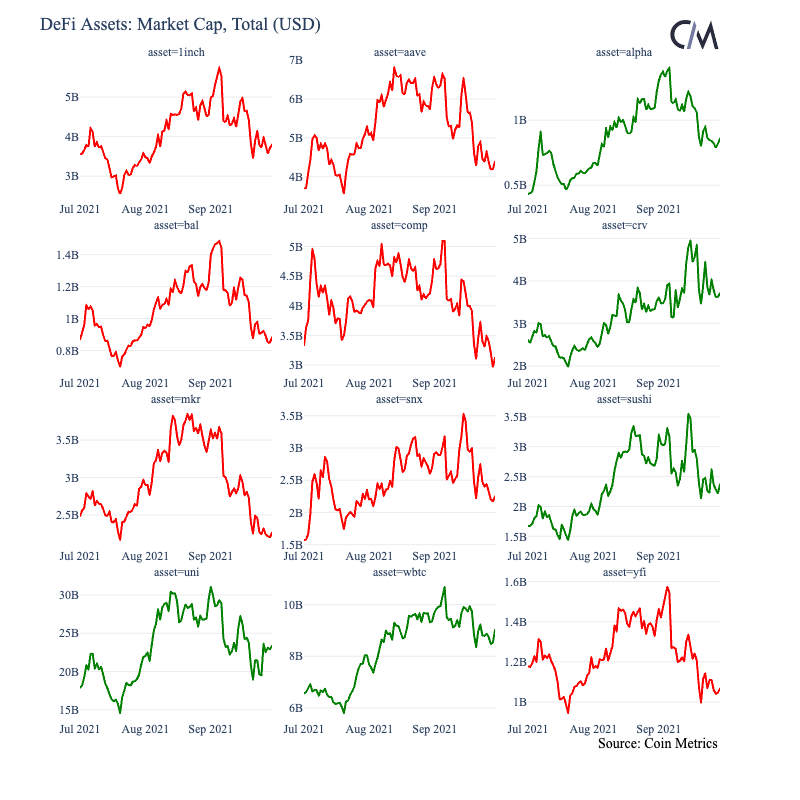
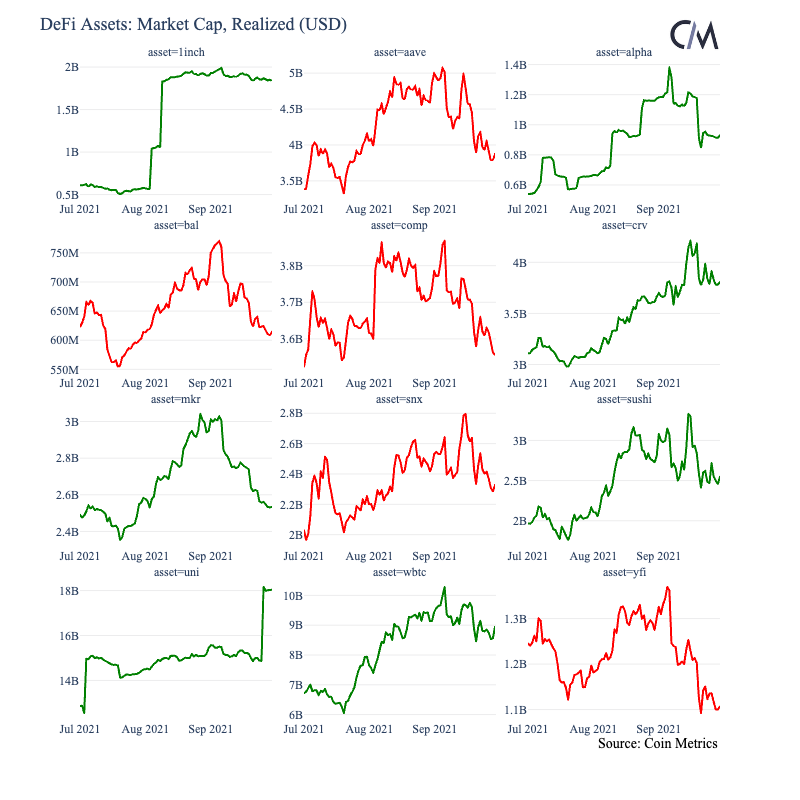
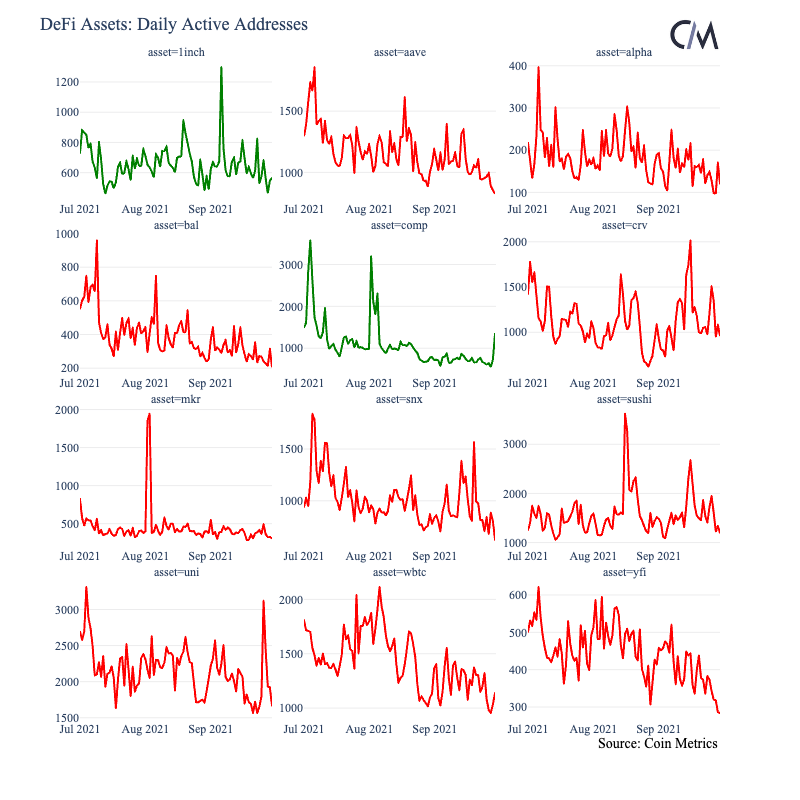
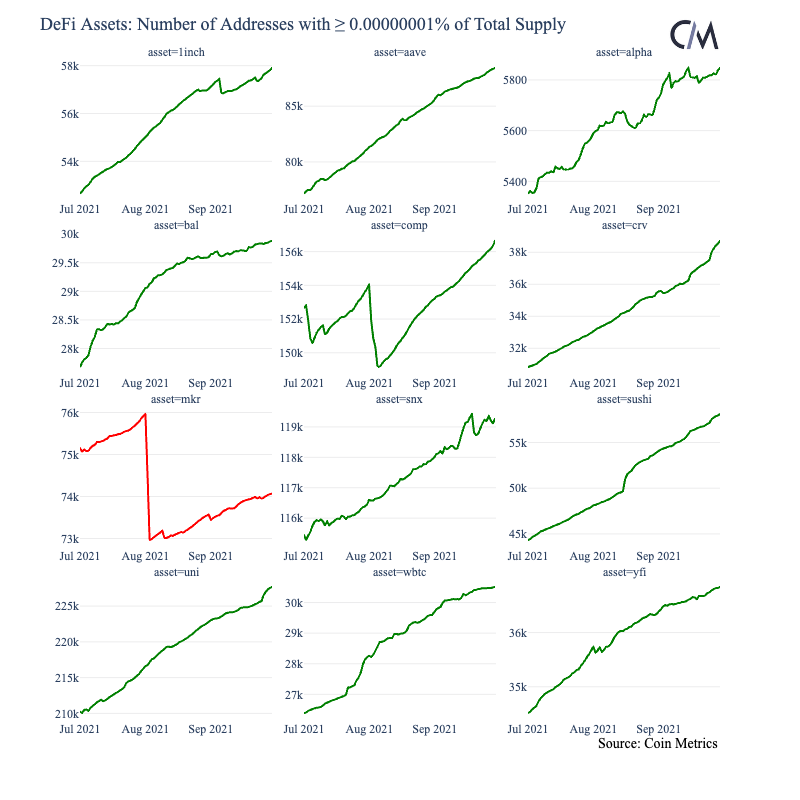
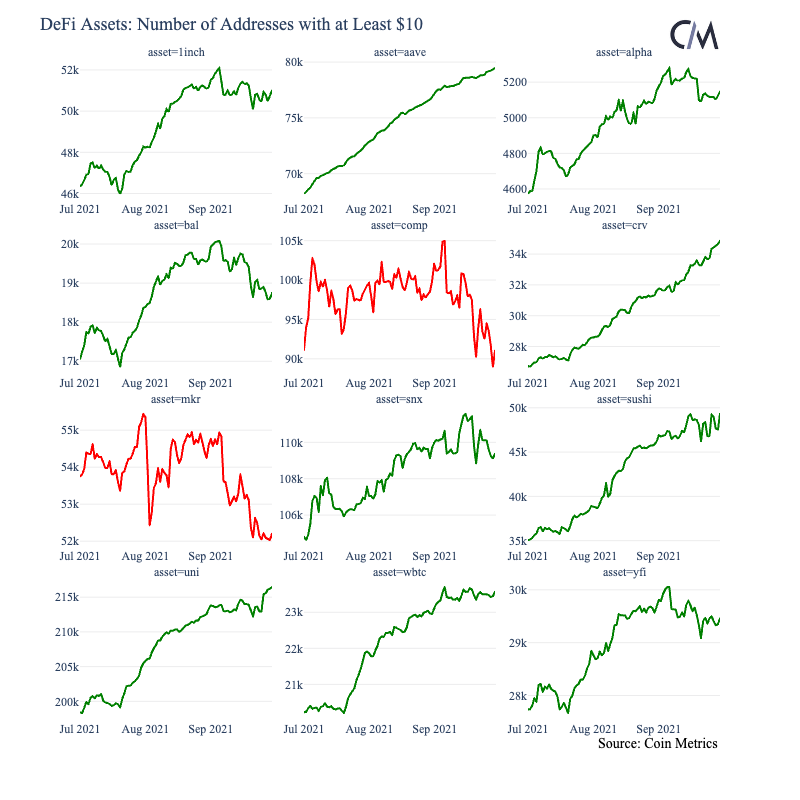
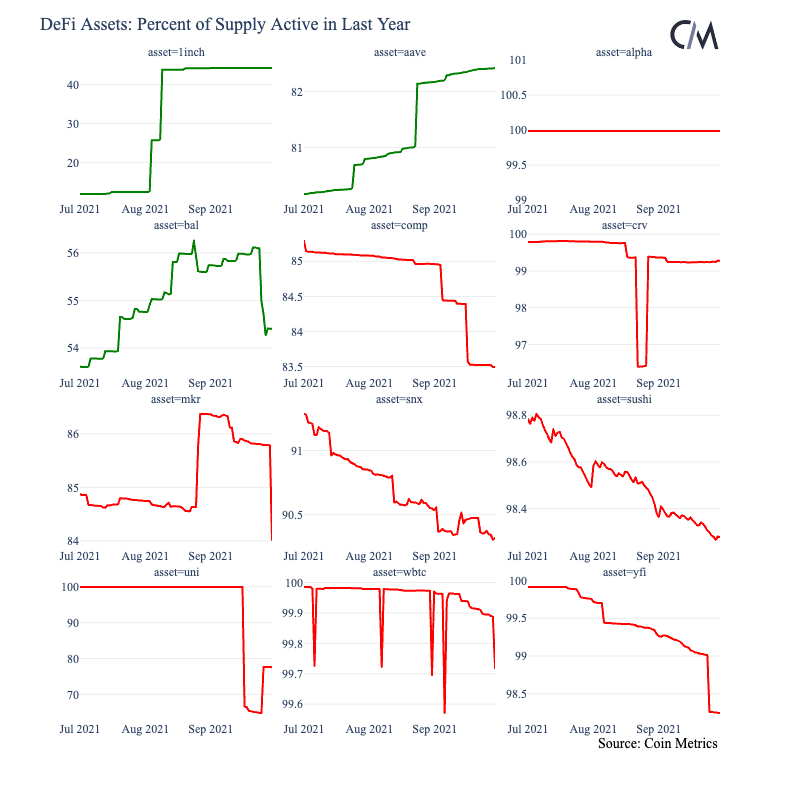
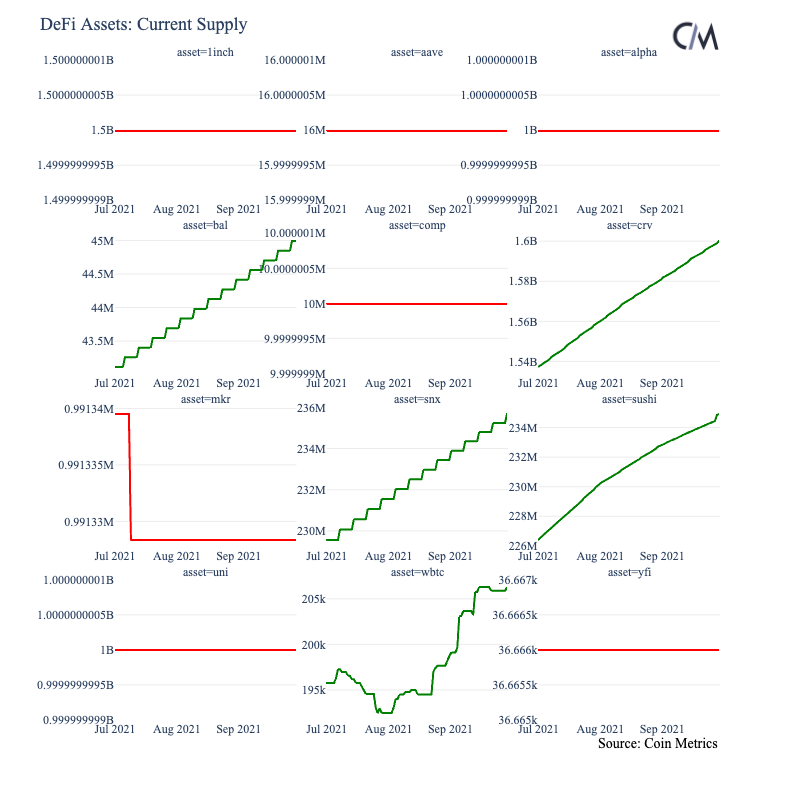
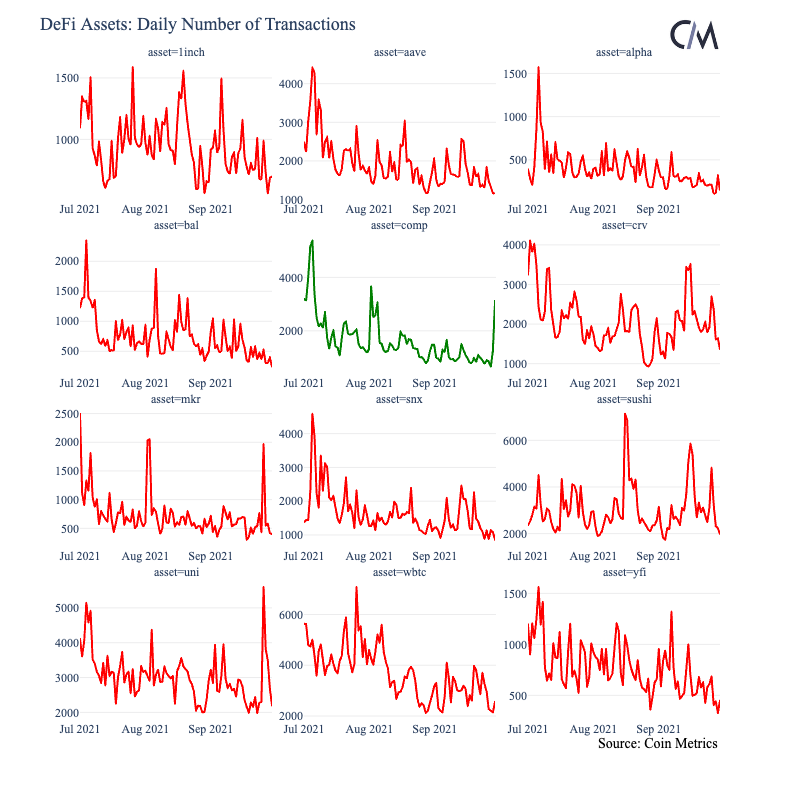
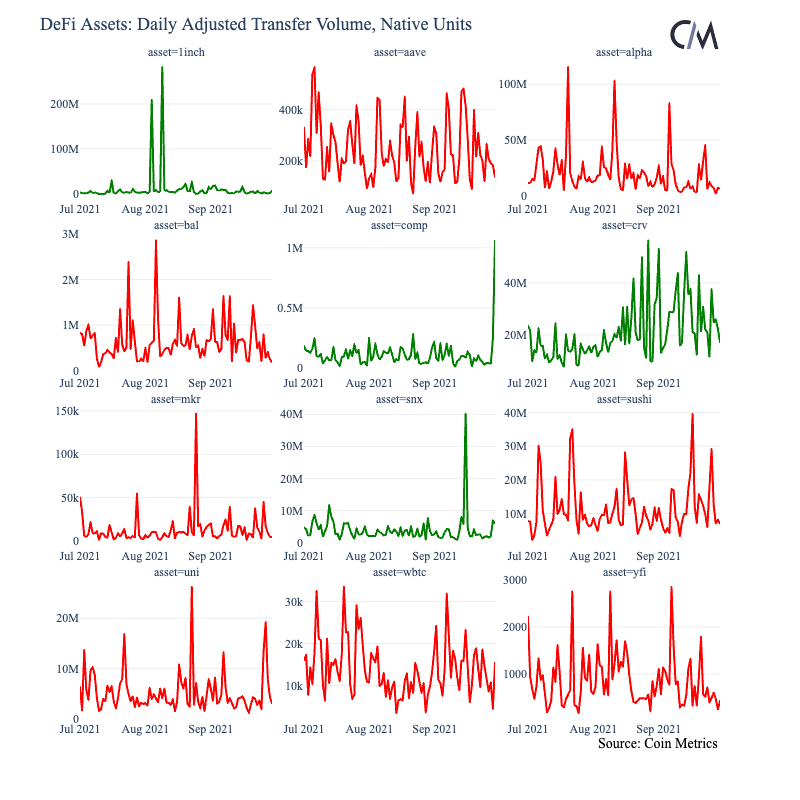
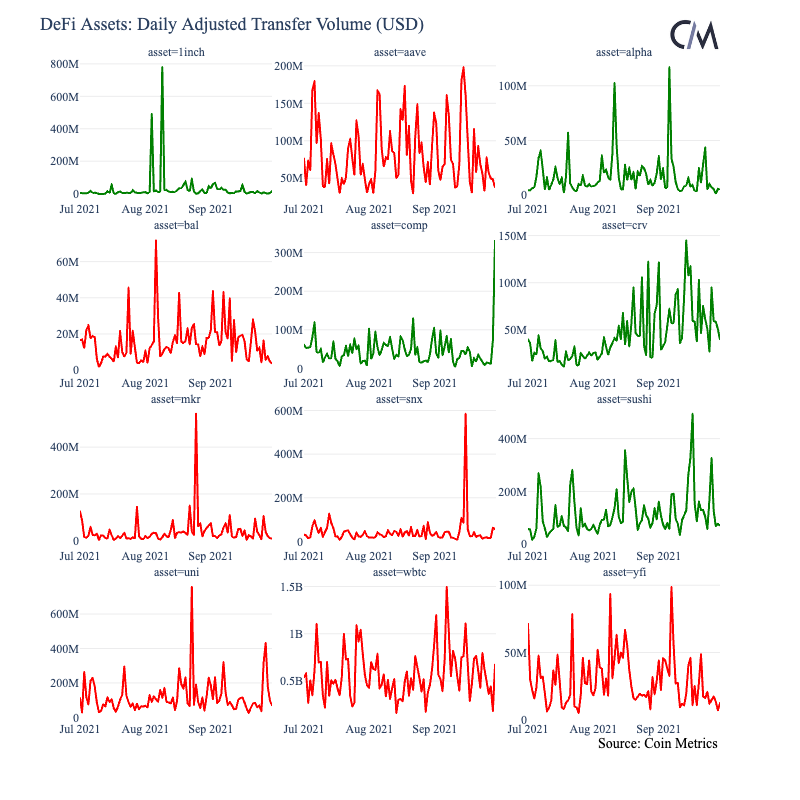
DeFi Assets


Stablecoins