Coin Metrics is pleased to announce the release of NDP 5.0, which features 30 new metrics and 5 new assets for on-chain analysis.
Asset Additions
NDP 5.0 brings 5 new assets to the Coin Metrics coverage universe:
- Dfinity Internet Computer (ICP)
- Polygon (MATIC_ETH)
- Perpetual (PERP)
- Revain (REV_ETH)
- Livepeer (LPT)
Users of our Network Charts and API Catalog will see that Dfinity Internet Computer (ICP) features “CM Labs” or “Experimental” tags, respectively. ICP is being released under our CM Labs initiative, which enables us to add experimental assets to NDP with the caveat that service uptime might not be as optimal as more established assets. These tend to be relatively new assets with fragile nodes, which means their metric availability and service uptime might be impacted without prior notice.
CM Labs enables us to be faster at releasing newer networks and assets to our clients that are still under active R&D. As exciting as this is, we advise caution when using CM Labs data for critical operations as the tag signals that these assets have not been as extensively tested relative to more established networks.
Metric Additions Summary
- EIP1559 was recently implemented on the Ethereum network and we have devised 10 new metrics to track its adoption and impact.
- Given the hypothesis that EIP1559 will have an impact on Ethereum’s mining ecosystem, we have also expanded our Miner Flows coverage to ETH miners and mining pools.
- Address-level metrics continue to be a straightforward method to compare activity across different networks. As such, we have released 4 new address-level metrics to track new address creation, as well as aggregate activity.
- Ratios such as MVRV have once again provided invaluable insight into the recent market volatility. At the same time, there is increased awareness of the impact that miners have on market liquidity. In this release, we combine these two areas by implementing 4 new valuation ratios that incorporate miner holdings.
- In light of the ongoing debate over the predominance of retail versus institutional investors operating within cryptoasset networks, we have developed a new family of metrics that accounts for all transfers below a certain value threshold being settled in a network.
- As with previous releases, we have expanded the coverage of one of our marquee metrics, Free Float Supply (SplyFF), to the following assets: MATIC_ETH, SNX, SUSHI, and 1INCH.
5.0 Deep Dive
EIP-1559
Ethereum recently went through a considerable change in its monetary policy. Popularized as EIP1559, the name of its implementation proposal, this change introduced a new pricing mechanism for Ethereum transactions. Instead of paying for a gas price, Ethereum users must pay a mandatory base fee as a prerequisite to have their transactions included in a block. Base fees are dynamically adjusted to reflect network usage: they go up when there is increased demand for transaction settlement, and programmatically go down when that demand tapers.
Ethereum rallied for the adoption of this transaction type for one key reason: after a user pays a base fee, that fee is burnt. In other words, units of Ether used to pay for base fees are permanently taken out of circulation. This is a sharp contrast to the previous system, whereby all transaction fees were sent to miners. In order to track Base Fee prices and supply burnt, we have devised a new set of metrics for EIP1559 transactions:
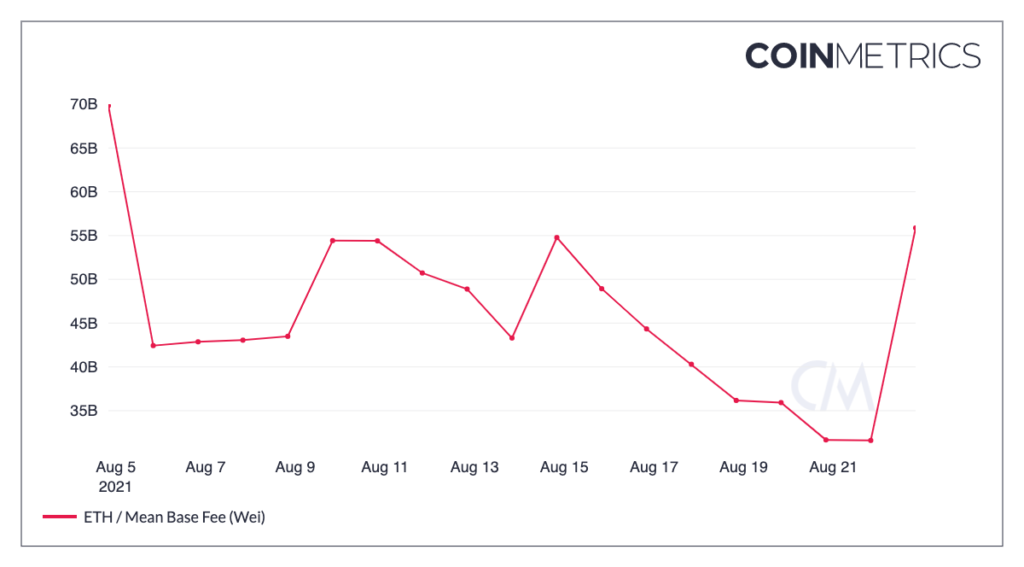
- Mean Base Fee (Wei), which measures the average base fee prices over time in the smallest ETH denomination, the Wei:
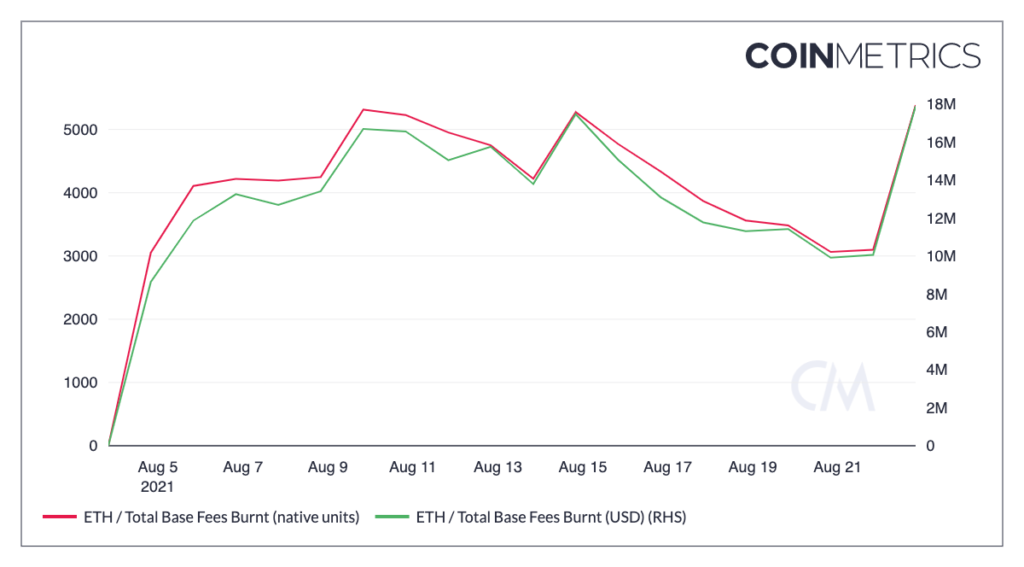
- Total Base Fees Burnt (USD) and Total Base Fees Burnt (native units), which measure the total ETH that was paid as Base Fee and consequently taken out of circulation.
- These metrics can be used to create ratios and empower macro analyses of Ethereum’s new monetary policy. The ratio below, for example, compares Total ETH Issued (IssTotNtv) with Total ETH Burnt (SplyBurntNtv). If this ratio is lower than 1, more ETH was Burnt than Issued, which signals monetary deflation, or a decrease in total ETH in circulation.
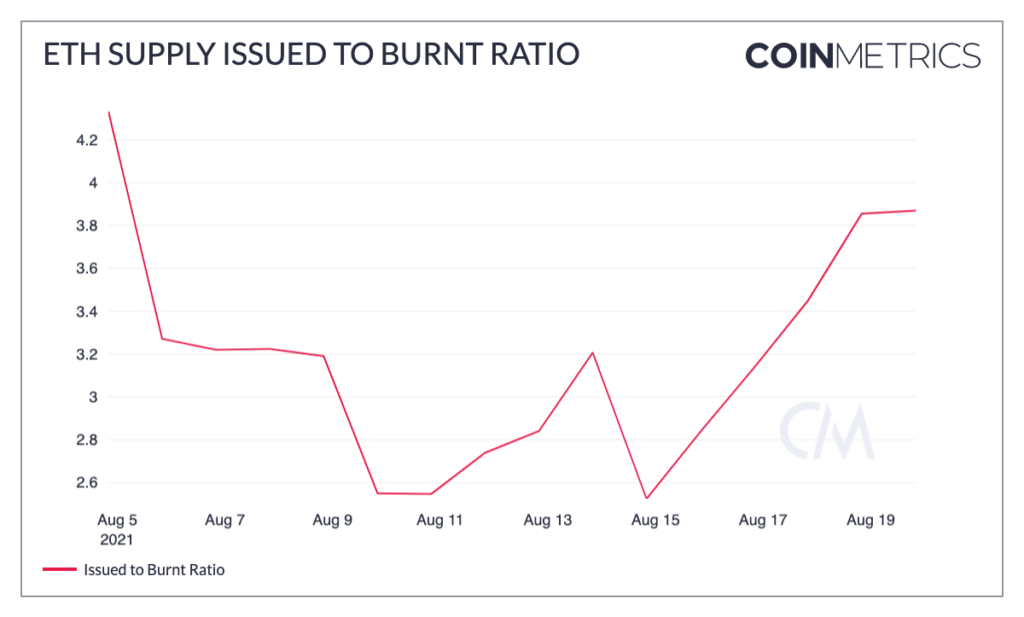
You can access the formula used to calculate this ratio here.
Paying a Base Fee is a prerequisite to have a transaction included in a block, but it does not guarantee that a transaction will in fact be picked by miners. In times of congestion, Ethereum’s transaction pricing mechanism reverts to a first-price auction, much like Bitcoin. In such events, users must pay for a Miner Tip (also known as a Priority Fee) in addition to the Base Fees. In essence, Miner Tips were designed to nudge miners to prioritize user transactions in times of network congestion. In order to track Base Fees, we have also devised the following metrics:
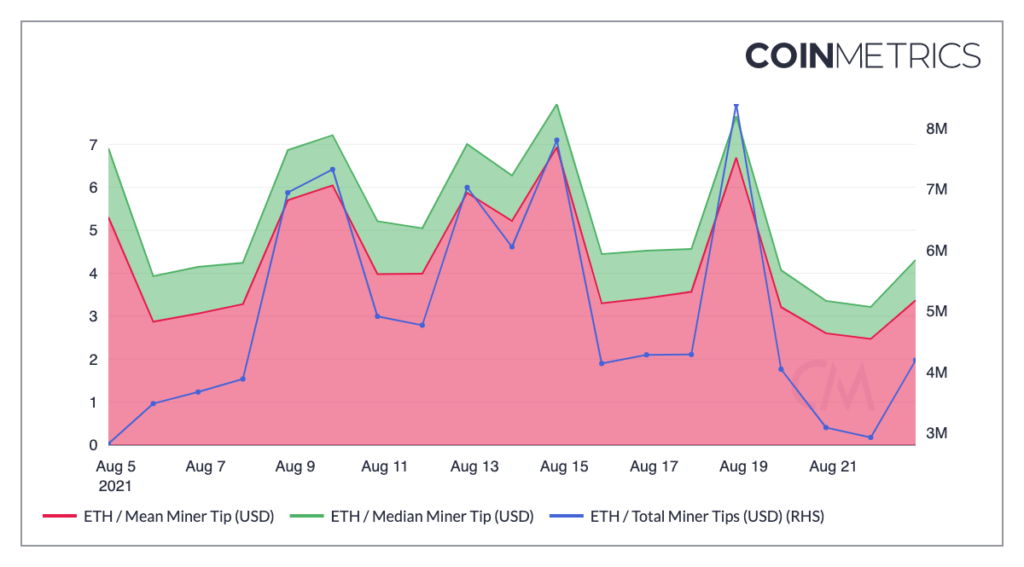
Not all wallets have natively implemented the EIP1559 transaction format upon activation. Although EIP1559 was introduced via a hard fork and, as such, it is mandatory for all network participants, there still exists a mechanism within Ethereum nodes that converts legacy transactions into EIP1559. This was put in place to minimize the impact that the new transaction type would have on Ethereum wallets.
In light of this, we have also devised the following metric that can be used to track the native adoption of the EIP1559 transaction format from industry wallets:
- EIP1559 Tx Cnt, which showcases the sum count of transactions taking place in the network with the native EIP1559 format. When combined with the legacy Tx Cnt, Clients can have a view on the adoption of EIP1559.
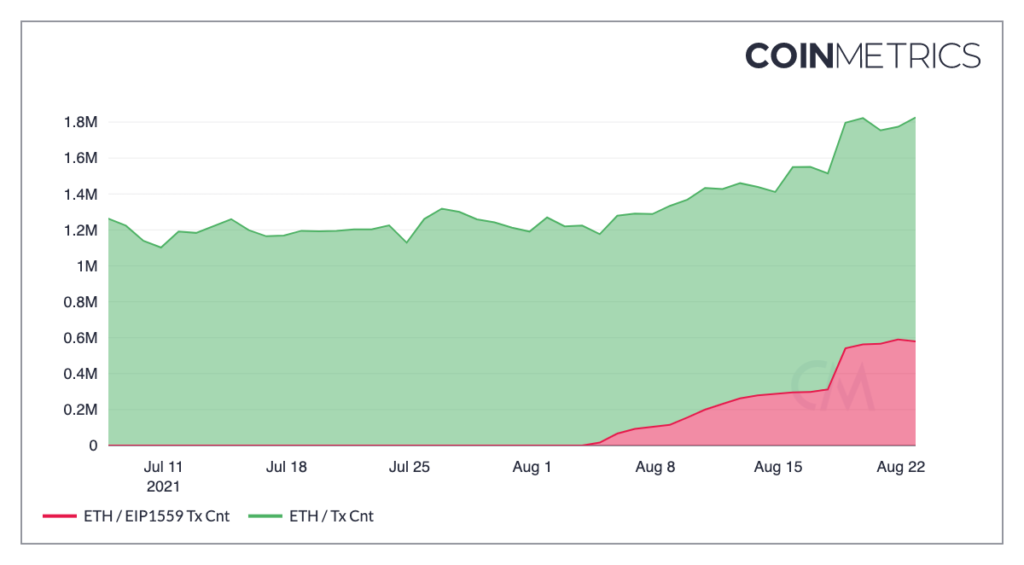
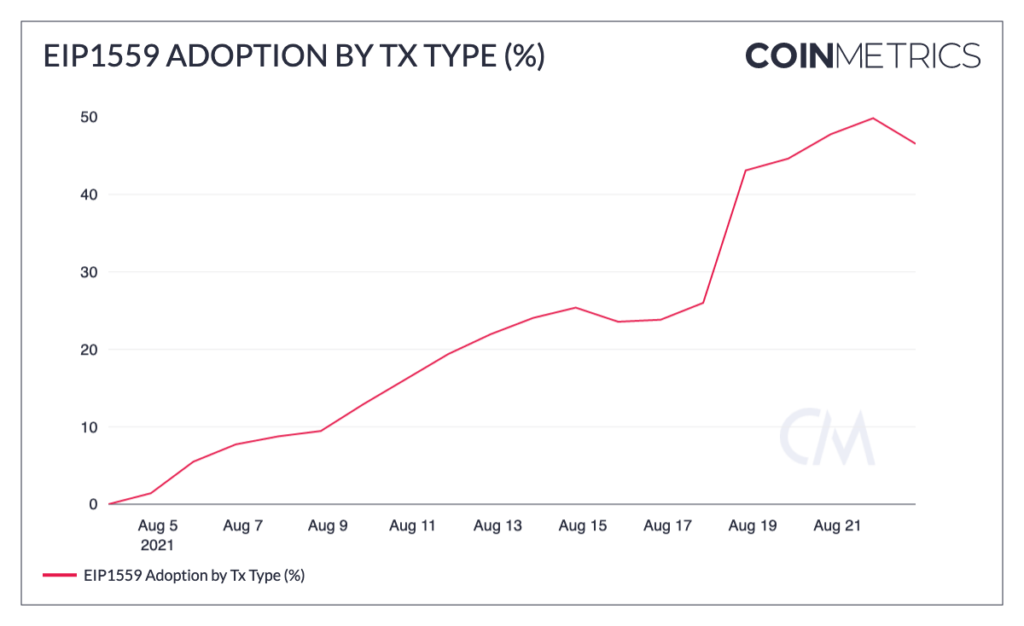
The chart above shows the number of transactions that are natively EIP1559-compliant (red), relative to all transactions taking place in the network (green). The ratio of both metrics can be calculated using our Formula Builder to get a percentage of the adoption of EIP1559:
Miner Flows Expansion
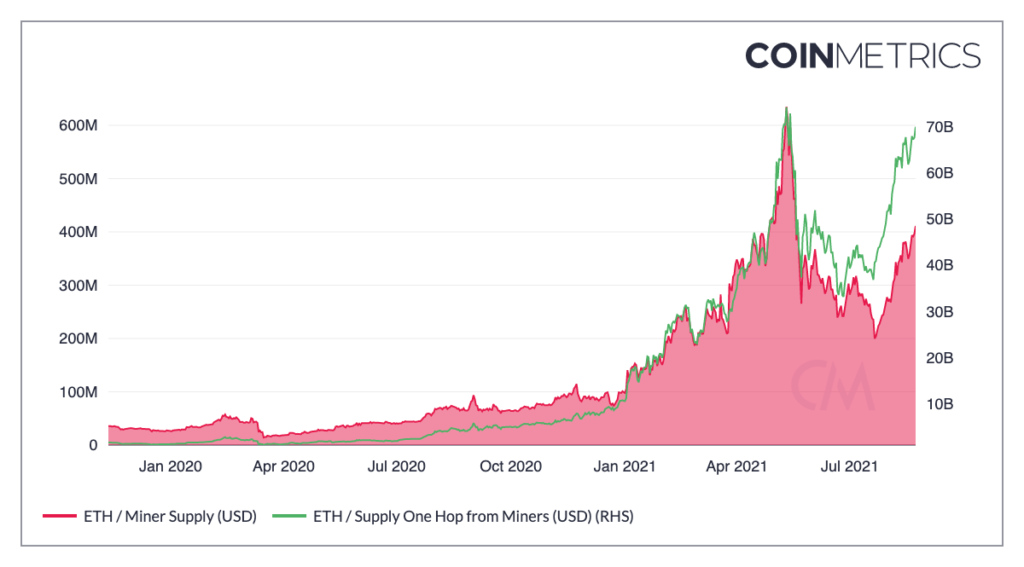
In order to track the health of Ethereum’s mining ecosystem post EIP1559, we have also expanded our Miner Flows to support ETH. Clients now have access to the full set of Miner Flows metrics for Ethereum. We believe that flows will be an important data point to track as miner revenue is expected to continue to decrease (at the protocol layer, at least).
However, as showcased by the chart above, the adoption of EIP1559 has not affected the ETH accumulation trend currently observed in addresses that belong to Miners (1-hop) as well as Mining Pools (0-hops).
New Address Metrics
In response to client feedback, we have also expanded our address activity and count metrics.
- In addition to Daily Active Addresses (AdrActCnt), Active addresses now support Weekly (7-day) as well as Monthly (30-day) resolutions.
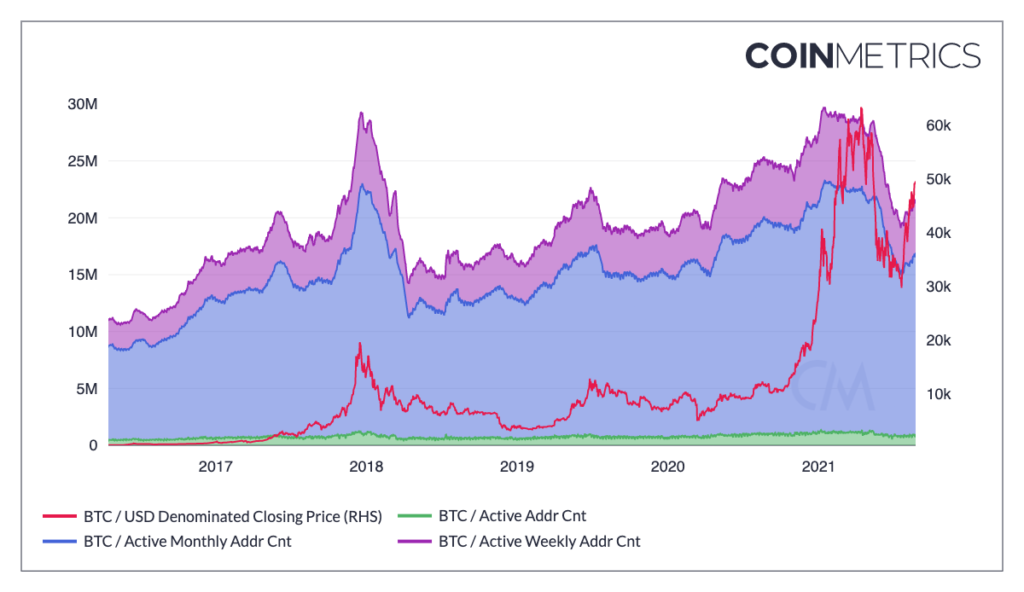
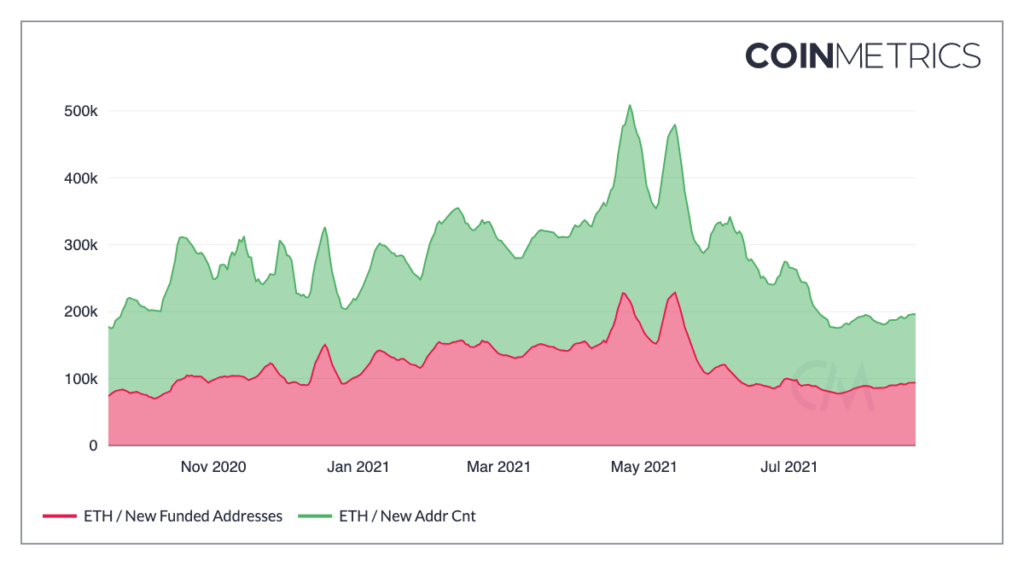
Additionally, we have released 2 new address count metrics that sum all New Addresses that were created within a time interval: New Addr Cnt, which showcases all new addresses observed in the network over the previous day, and New Funded Addr Cnt, which is a subset of New Addr Cnt that only counts addresses with a balance greater than 0.
New Valuation Ratios
Valuation Ratios like MVRV continue to provide invaluable insight into market cycles by comparing the market valuation (Market Cap) with a network-wide cost basis (Realized Cap). At the same time, the existing miner emigration process out of China has highlighted the impact that miners have on short-term market liquidity. In this release, we have decided to combine both areas by developing 4 new valuation ratios focused on mining.
- Miner Cap to Thermo Cap (MCTC), which represents the ratio of Miner Cap relative to Thermo Cap at the end of that interval. Miner Cap represents all funds held by mining pools and miners and is calculated as the sum of SplyMiner0HopAllUSD (supply held by mining pools) and SplyMiner1HopAllUSD (supply held by miners). Thermo Cap is RevAllTimeUSD and represents the USD value of all funds disbursed to miners at the time of issuance.
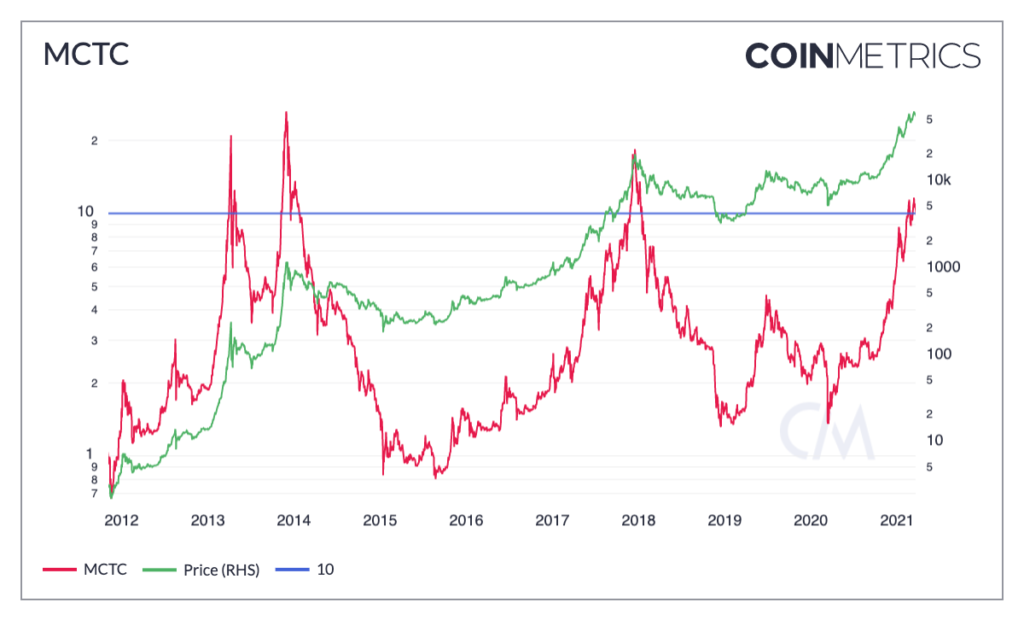
Historically, a threshold of 10 has been indicative of market tops. When this threshold is breached, it might indicate that miners are more willing to sell their assets, as their profit margins have widened. Conversely, as this ratio dips below 2, it might indicate market bottoms as miner’s willingness to sell decreases.
- Miner Cap to Realized Cap (MCRC), which represents the ratio of Miner Cap over Realized Cap at the end of that interval. Miner Cap represents all funds held by mining pools and miners and is calculated as the sum of SplyMiner0HopAllUSD (supply held by mining pools) and SplyMiner1HopAllUSD (supply held by miners). Realized Cap (CapRealUSD) is defined as the sum USD value based on the USD closing price on the day that a native unit last moved (i.e., last transacted) for all native units.
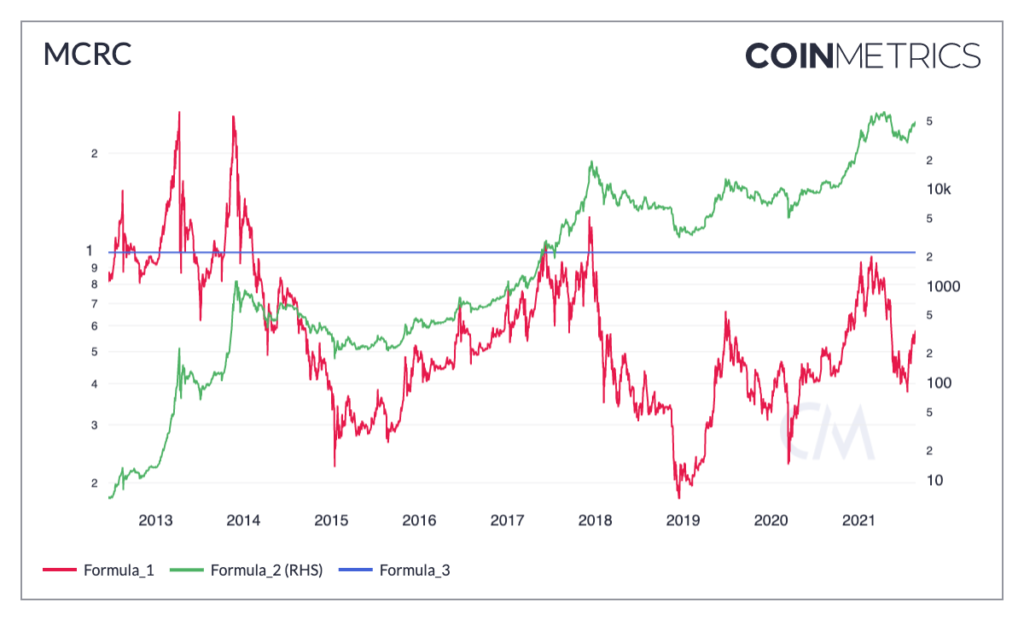
When comparing the USD value of what miners have in custody relative to the cost basis of the network as a whole, a natural threshold of 1 is relevant. When this threshold is breached, it might indicate that miners are more willing to sell their assets, as their profit margins have widened. Conversely, as this ratio nears zero, it might indicate miners are selling at a loss.
- Miner Outflow to Miner Revenue (MOMR), which represents the ratio of Miner Outflows over Miner Revenue at the end of that interval. Miner outflows represent the sum of funds being sent by miner addresses (1-hop from the coinbase) and are calculated as FlowMinerOut1HopAllNtv. Miner Revenue represents the sum of funds (new coins and transaction fees) sent to miners over a time window and is calculated as RevNtv.
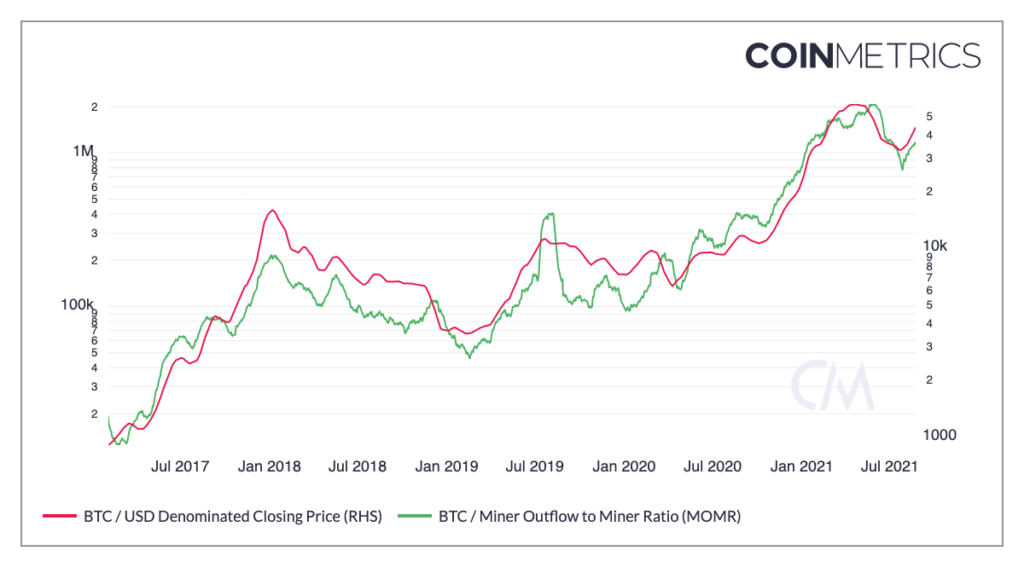 When comparing the USD value of what miners are sending relative to the funds they are receiving, there appears to be a negative relationship with price. That makes intuitive sense as it might indicate that miners are sending more funds out (which might show a higher willingness to sell) relative to what they are receiving as revenue. As such, this ratio might serve as a barometer for miner sentiment and identify liquidity events when miners might be bearish.
It is important to note that the mere act of sending funds from one address to another does not necessarily signify the act of selling. Only when there is a clear & noticeable uptick in this metric that the speculation that miners are selling is defensible, given that outflows might signify more mundane events such as a cold wallet shuffle. Additionally, it is important to note that Miner outflows are naturally very volatile. As such, we recommend using a monthly (30d) Moving Average when visualizing this metric.
- Realized Cap to Thermo Cap (RCTC), which represents the ratio of the Realized Cap over Thermo Cap at the end of that interval. Realized Cap (CapRealUSD) is defined as the sum USD value based on the USD closing price on the day that a native unit last moved (i.e., last transacted) for all native units. Thermo Cap is calculated as RevAllTimeUSD and it represents the USD value of all funds disbursed to miners at the time of issuance.
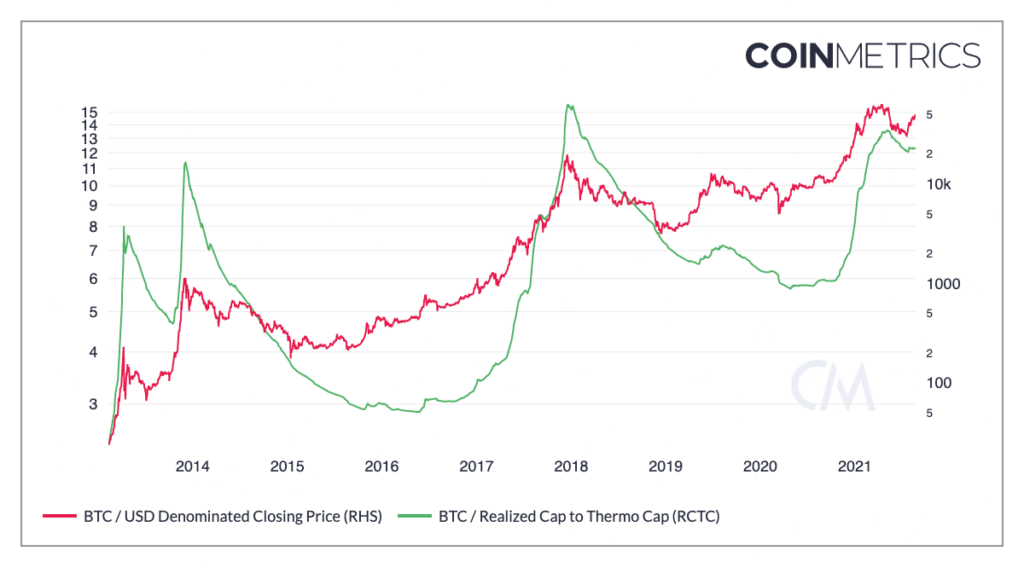
This metric fundamentally showcases the impact of miner liquity in the overall market. When the USD value of miner income is low relative to what is being realized on-chain, this could be interpreted as a sign of market tops. This metric could also be interpreted as the profit margin that might be realized by miners as it showcases the gap between profit-taking. Historically, a threshold of 10 has been indicative of market tops as a wide profit margins are being realized relative to the USD value being issued to miners.
New Payments Metrics
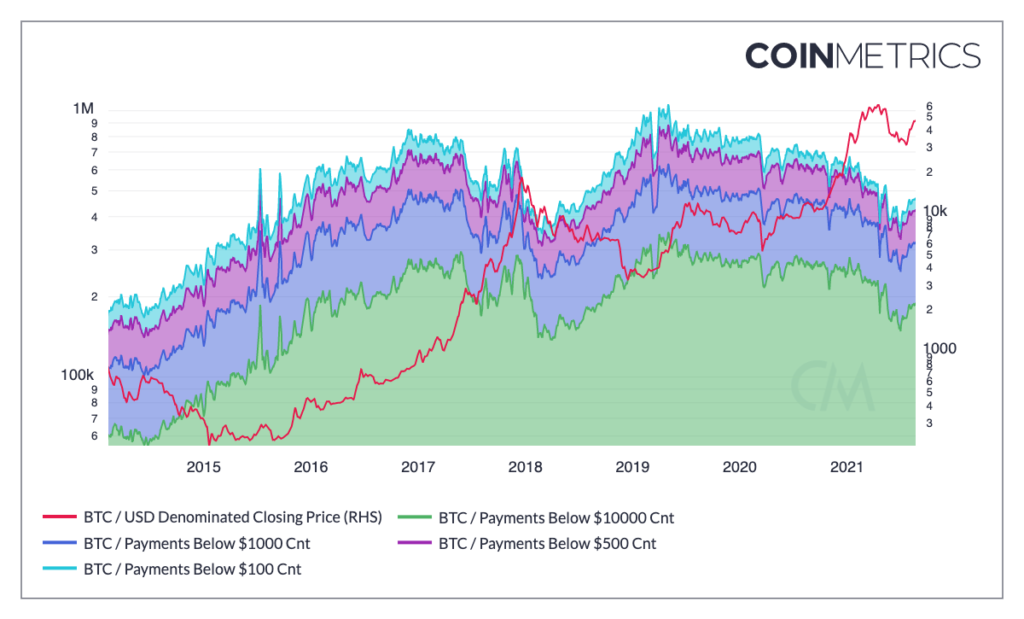
In order to better reason about the nature of the users interacting with a cryptonetwork, it is important to understand the value of the payments that are being settled. As such, we have developed a new family of metrics that accounts for all transfers below a certain value threshold being settled in a network. This new family is called Payments (Xfers) Below $X, where $X represents the supported value thresholds. At this time, the following value USD thresholds are supported: $100, $500, $1,000 and $10,000. Through this framework, we calculate 2 metric types:
- Sum of Payments Below $X USD, which represents the sum of all payments (transfers) that have occurred in the measuring interval below a specific USD amount, displayed in units of USD.
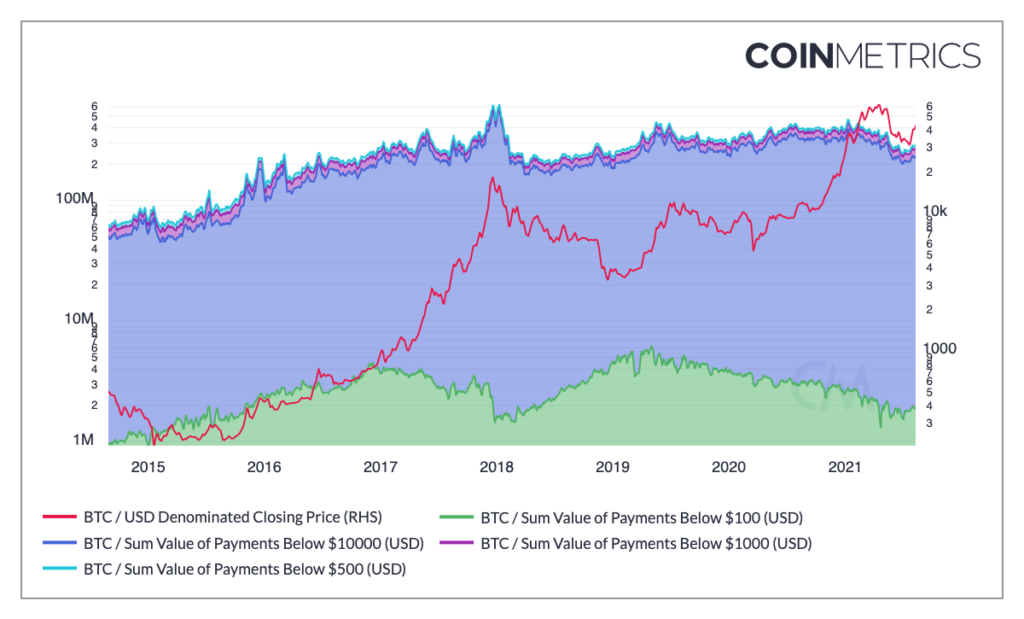
- Count of Payments Below $X USD, which represents the count of all payments (transfers) that have occurred in the measuring interval below a specific USD amount, displayed in units of USD.
New Free Float Support
As with previous releases, we have expanded the coverage of one of our marquee metrics, Free Float Supply (SplyFF) to the following assets.
- MATIC_ETH
- SNX
- SUSHI
- 1INCH
